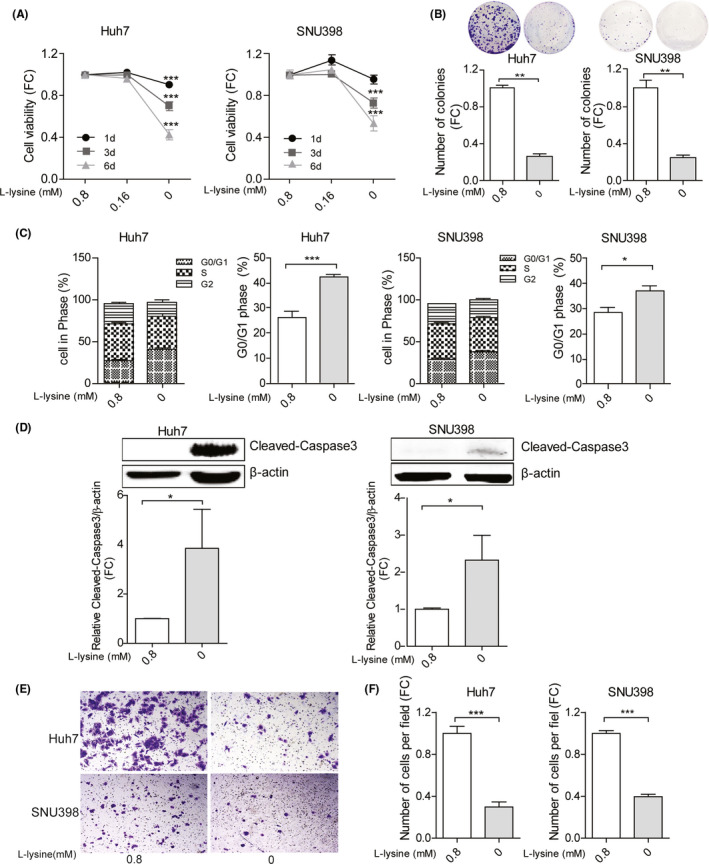
Figure 4.

The effects of lysine on HCC cell lines. (A) The effects of lysine on cell growth measured by MTT assay following 1, 3 and 6 days of culture (n = 20). (B) Lysine affects the number of single cell‐derived colonies as assayed 2 weeks following seeding (n = 6). (C) The effects of lysine on cell cycling was measured by Propidium Iodide staining, and the fraction of cells in G0/G1 was quantified (n = 6‐9). (D) Protein expression levels of cleaved‐Caspase 3 in Huh7 and SNU398 HCC cells. The intensity was quantified relative to β‐actin (n = 5). Huh7 and SNU398 cells were cultured with or without lysine for 3 days. (E) Representative images of migrating cells with or without lysine and (F) quantification of the number of migrating cells (n = 10‐20). Quantification of A, B, D and F data without lysine groups were relative to with lysine group. Data are presented as mean ± SEM. *P < .05; **P < .01; ***P < .001, by the Mann‐Whitney test. HCC, hepatocellular carcinoma; FC, fold change
