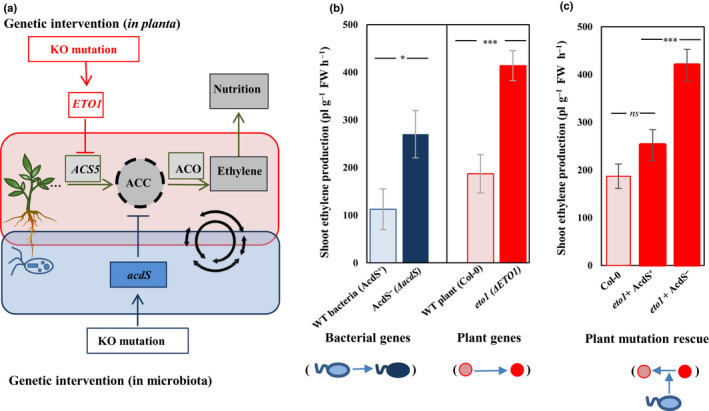
Fig. 2.

(a) Conceptual overview of the joint coregulation of ethylene signaling by plants and microorganisms. Plant 1‐aminocyclopropane‐1‐carboxylic acid synthases (ACS) create a pool of 1‐aminocyclopropane‐1‐carboxylic acid (ACC) in response to environmental inputs. ACC is later converted into ethylene by the plant enzyme ACC oxidase, triggering a range of traits in a dose‐dependent way. Plant‐associated microorganisms can influence ethylene cycling, for instance by producing the enzyme ACC deaminase (via the bacterial acdS gene) that will degrade ACC. By placing plants and microbes as joint constituents of a common regulatory network, we show that we can intervene in plant phenotype via KO mutations in the bacterial acdS gene or in the plant ETO1 gene, causing an increase in the ACC pool and ultimately ethylene and the traits it regulates. In this study, we selected parallel mutations in the plant (Col‐0 vs eto1 plant mutant) or bacterial genome (wild‐type (WT) vs AcdS‐ mutant bacteria) and assessed their effect on plant ethylene concentrations. The colors show the mutation in the plant (red) and bacterial genome (blue): the darker color shows the mutation that resulted in increased ethylene production; pink, the Col‐0 (WT plant); red, eto1 (ethylene over producer); light blue, Col‐0 associated with WT ACC deaminase‐producing bacteria; dark blue, Col‐0 associated with ACC deaminase‐deficient mutant bacterial. (b) Effect of mutations in bacterial (blue bars) and plant genomes (red bars) on ethylene concentrations in a gnotobiotic system. Both plant‐ and bacterial‐encoded mutations resulted in a similar two‐fold increase in plant ethylene concentrations, demonstrating the parallelism in phenotypic effects between plant‐ and microbiota‐ associated traits. (c) ACC deaminase synthesis by root‐associated bacteria rescues the wild‐type plant phenotype in an eto1 genetic background, validating the homologous nature of plant‐ and microbial‐encoded traits affecting ethylene signaling. WT‐associated bacteria (light blue) rescue the effects of mutation in the plant genome (dark red to pink). Error bars show ± SE. Columns with asterisks are significantly different according to a t‐test (***, P < 0.0001; *, P < 0.05; ns, not significant).
