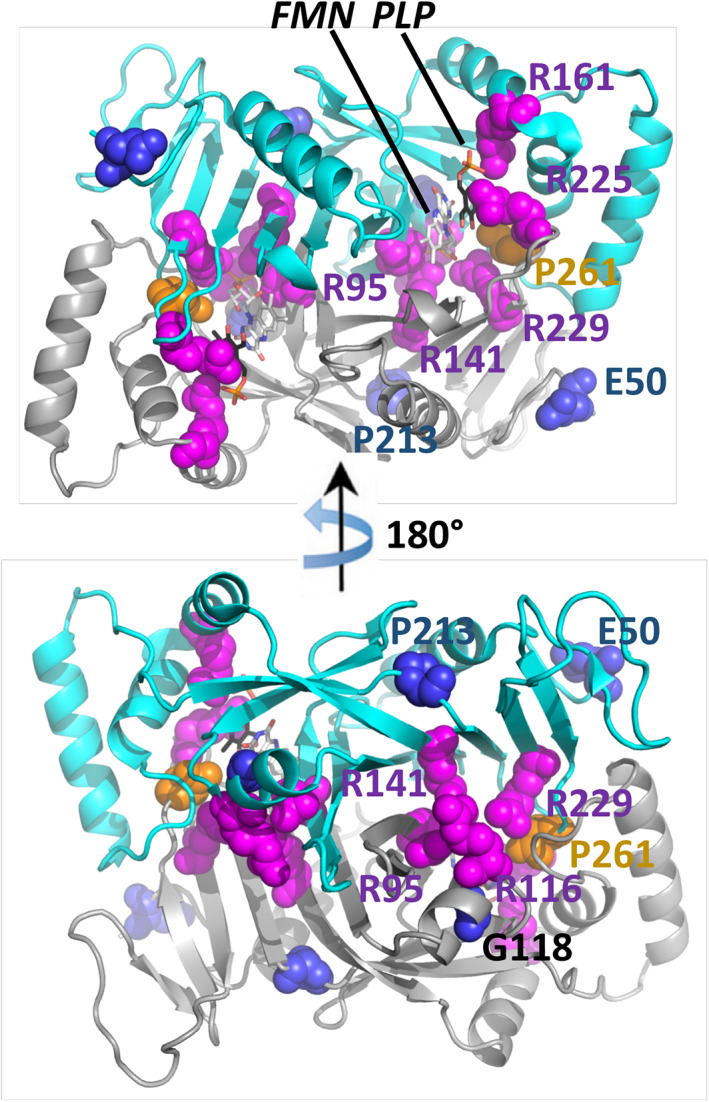
FIGURE 3.

Overview of the reported point mutations. The crystal structure (PDB ID 1nrg) shows the post‐catalytic PLP (magenta) and FMN (dark lilac) as stick models. Point mutations are shown in sphere representation. Green coloration indicates that the mutation directly affects the binding and processing of the substrate and cofactor. Orange coloration indicates that the mutation decreases the protein's overall stability. FMN. flavin mononucleotide; PLP, pyridoxal 5′‐phosphate
