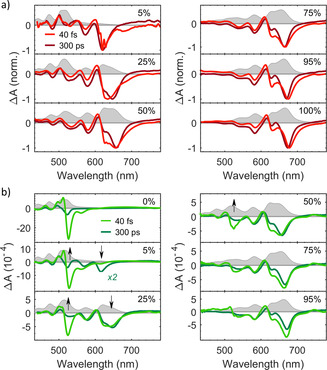
Figure 2.

TA spectra of TET:PEN blends. a) Normalized TA spectra with λ exc=620 nm immediately after excitation (40 fs) and at long delays (300 ps). b) TA spectra with λ exc=520 nm immediately after excitation (40 fs) and at long delays (300 ps). Arrows indicate visible changes in the GSBs of PEN and TET. The corresponding absorption spectra are shown in light gray in the background. Note that the TA spectra in (a) are normalized for better comparison of the spectral shape but are not normalized in (b) to emphasize the effect of energy transfer.
