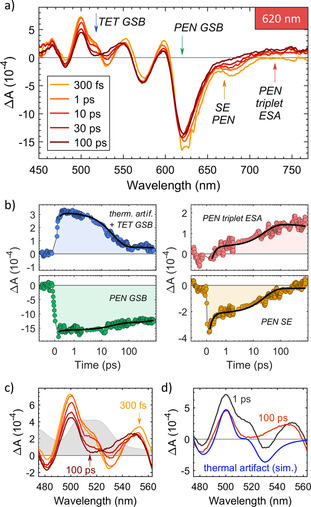
Figure 4.

a) TA spectra and b) time traces of the blend with 5 % PEN using an excitation wavelength of λ exc=620 nm. The arrows in panel (a) indicate the wavelengths of extracted time traces in panel (b). The black lines in (b) are fit results of the GA. Data points affected by coherent artifacts have been removed in panel (b) for better visibility. Note the change from linear to logarithmic scale of the time axis at 1 ps. For residuals of the fits, see Figure S9. c) Evolution of the TA‐spectrum in the spectral region of the TET GSB. The absorption spectrum of the 5 % PEN blend in this region is shown in gray in the background. Note that the legend in (a) also applies to (c). d) Comparison of experimental TA‐data at two different delay times in the region of the TET GSB and the thermal artifact, simulated by the derivative of the steady‐state absorption spectrum.
