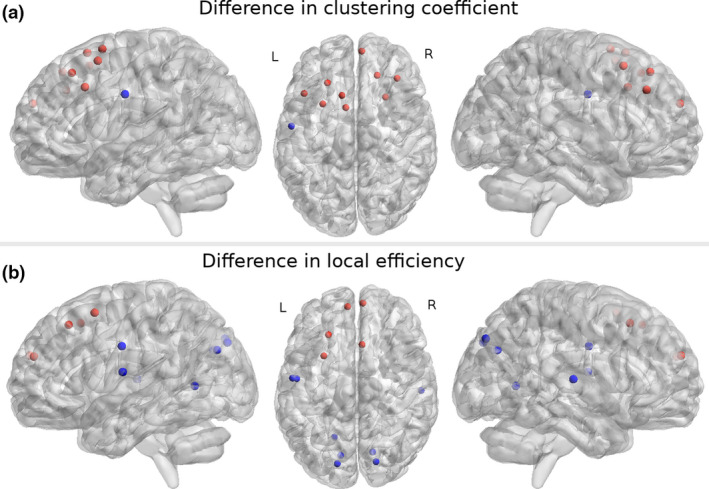
Figure 3.

Significant (p < 0.05, two‐sample t test, false discovery rate) differences in graph measures in restless legs syndrome patients compared to healthy controls. Regions where significant differences were found in (A) clustering coefficient and (B) local efficiency. Red nodes represent regions where graph measures were significantly (p < 0.05) higher and blue nodes where measures were significantly lower in RLS patients compared to healthy controls. Left sagittal, axial, and right sagittal views are shown. The results were calculated on averaged nodal measures with graph densities between 0.1 and 0.5. Nodes present atlas regions from An Atlas of Intrinsic Connectivity of Homotopic Areas and Automated Anatomical Labeling that are presented in their centroid stereotaxic coordinates (Montreal Neurological Institute). L, left; R, right. [Colour figure can be viewed at wileyonlinelibrary.com]
