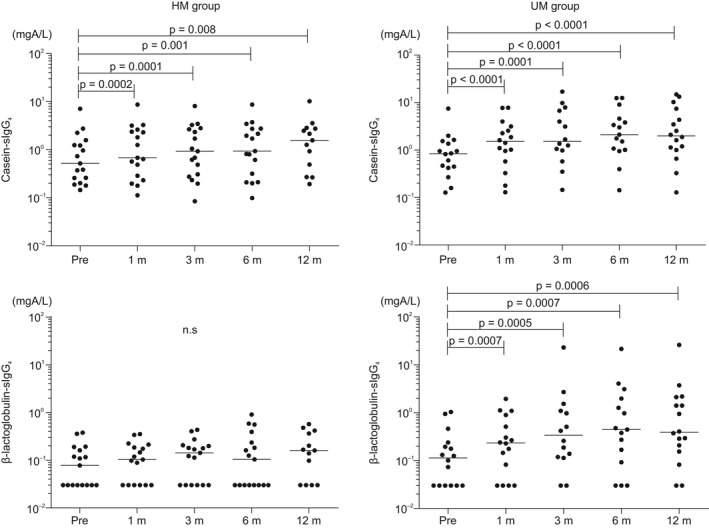
FIGURE 4.

Casein‐ and β‐lactoglobulin‐specific immunoglobulin G4 changes in the HM and UM groups; the x‐axis represents casein‐ and β‐lactoglobulin‐sIgG4, and the y‐axis represents time from start of OIT. β‐lactoglobulin‐sIgG4 levels significantly increased only in the UM group. HM, heated milk; sIgG4, specific IgG4; UM, unheated milk
