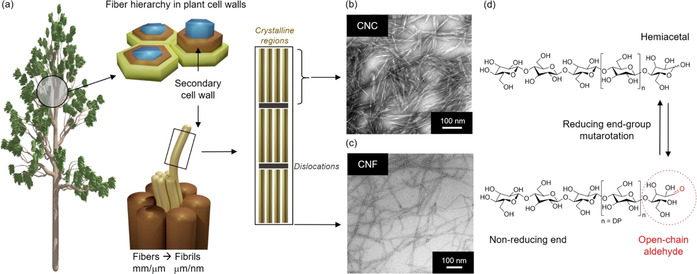
Figure 1.

a) Schematic representation of the fiber hierarchy in plant cell walls, and the isolation of rod‐like CNCs and CNFs. b) TEM image of wood CNCs. [12] Adapted with permission from ACS (2013). c) TEM image of CNF, [13] modified with permission from ACS (2007). d) Molecular structure of cellulose, its reducing and non‐reducing end groups, and the tautomeric equilibrium between open‐chain aldehyde and hemiacetal.
