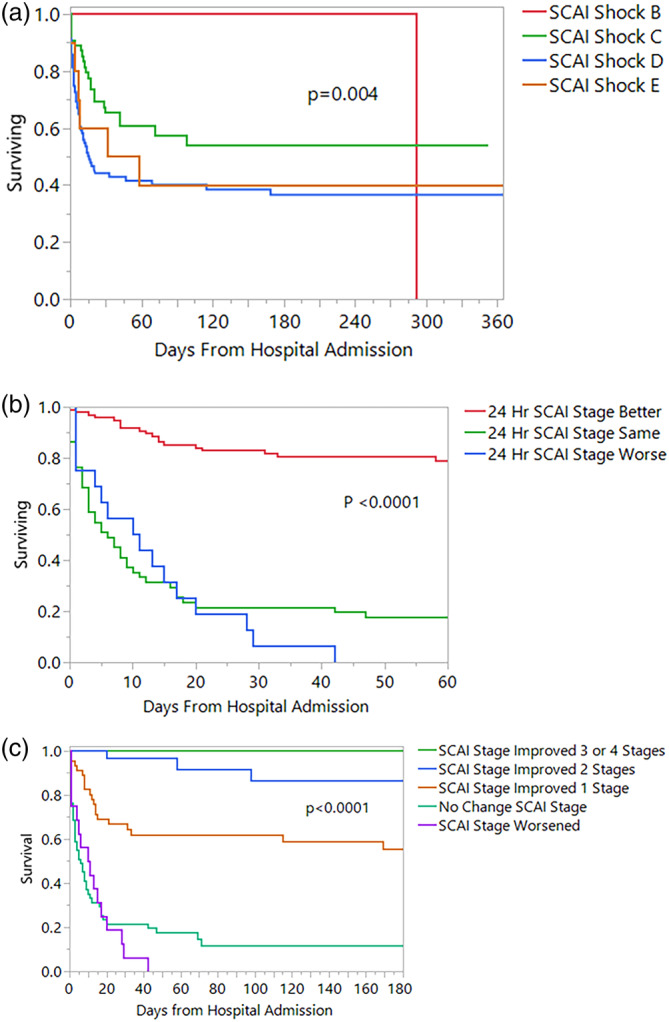
FIGURE 3.

Panel A: Survival by SCAI Shock Stage at initial shock team consult. This Kaplan–Meier plot shows a significant difference in the survival of patients according to initial SCAI Shock stage. There were no early deaths with SCAI stage B patients, with improved survival for SCAI C patients compared to the SCAI D and E groups. This illustrates the potent effect of deterioration or extremis states, which carry a very high mortality. Panel B: This Kaplan–Meier plot demonstrates survival of patients according to the change in SCAI Shock stage as assessed prospectively at 24 hr following initial shock team evaluation. Change is described as SCAI Shock stage better, worse or unchanged. Panel C: This Kaplan–Meier plot demonstrates survival of patients according to the change in SCAI Shock stage as assessed prospectively at 24 hr following initial shock team evaluation. Change is quantitated as the improvement or worsening of SCAI stages. SCAI, Society for Cardiac Angiography and Interventions [Color figure can be viewed at wileyonlinelibrary.com]
