FIGURE 3.

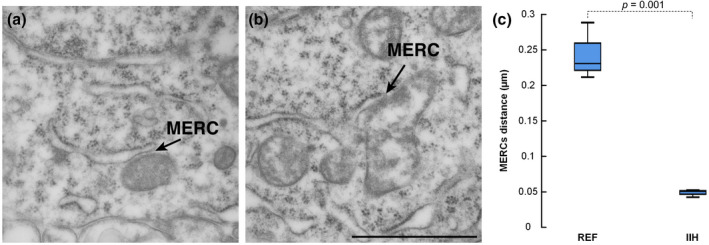
Reduced distance between mitochondria and endoplasmic reticulum in idiopathic intracranial hypertension (IIH). (a) EM reveals the endoplasmic reticulum (ER) and normal mitochondria in a reference (REF) individual, including visualization of the mitochondria–ER contact sites (MERCs). (b) The MERCs is shown in an IIH patient. Scale bar 1 µm. (c) The MERCs distance in IIH was 5.2‐fold shorter than in REF individuals (0.24 ± 0.04 vs. 0.05 ± 0.005 µm; p = 0.001; independent samples t test, t = 8.391, df = 4). The length of ER was similar in the REF and IIH patients (0.67 ± 0.30 vs. 0.92 ± 0.40 µm, p = 0.422; independent samples t test, t = −0.893, df = 4). Error bars are 95% CI. Magnification 43,000×; scale bar 500 nm
