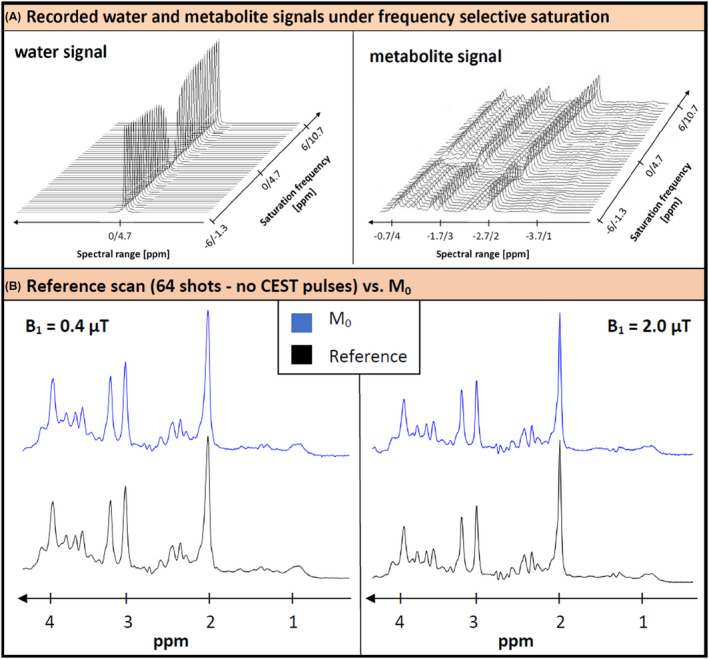
FIGURE 2.

Illustration of experimental data. (A) Impact of the frequency‐selective CEST saturation on the water and metabolite signal, recorded from the metabolite‐cycled semi‐LASER sequence, shown for a representative subject. The water signal intensity drops significantly for saturation close to its resonance frequency. For the metabolite spectra, the loss in signal intensity is also visible for the corresponding saturation frequencies. The ppm values are given in CEST reference (water at 0 ppm) and spectroscopy reference (water at 4.7 ppm). (B) Comparison of the reference scan without CEST pulses (64 averages) with the M0 scan at the smallest and highest B1 for a representative subject. They document sufficient spectral quality for all spectra and validity of M0 as the unsaturated spectrum even for high B1
