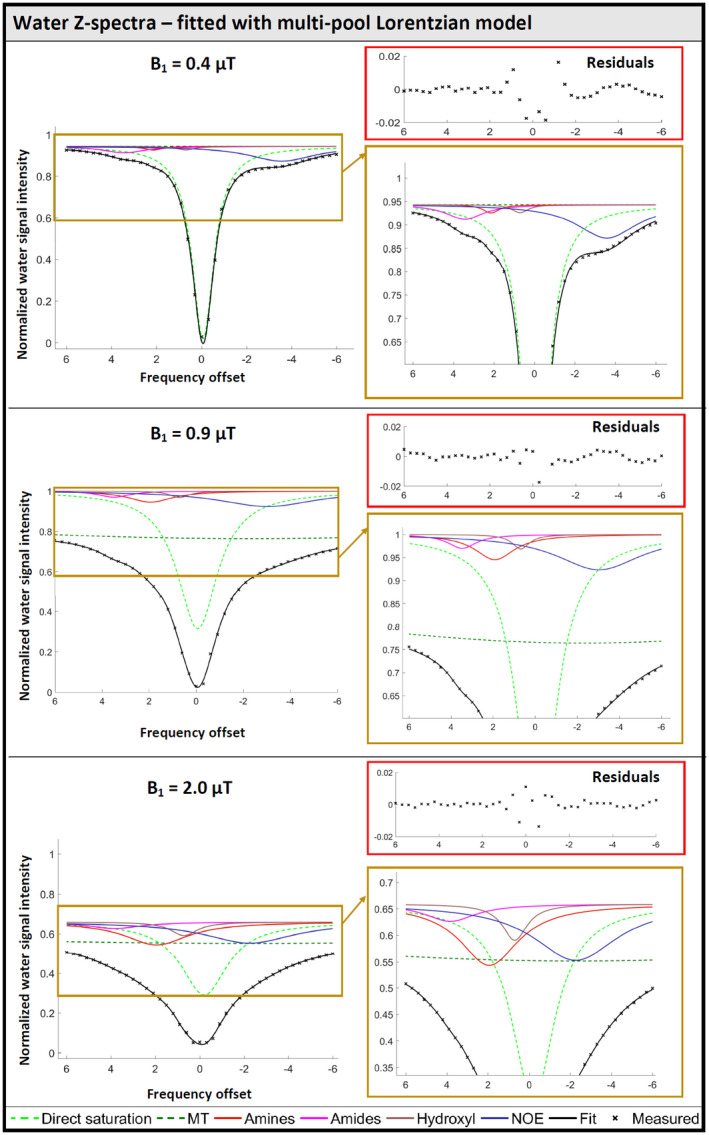
FIGURE 3.

Representative fit of a water Z‐spectrum with the multiple pool Lorentzian model for each B1. Saturation offset is given in CEST convention with water at 0 ppm. The direct water saturation, the broad MT and the overall signal reduction define the main shape of the Z‐spectrum. All components are displayed as Zbase − Ln. On the right, the scale is enlarged to show more details for the smaller contributors from the exchange effects downfield and the NOE effect upfield. The exchange effects of hydroxyls and amines increase with B1, whereas the exchange effect of amides remains fairly constant
