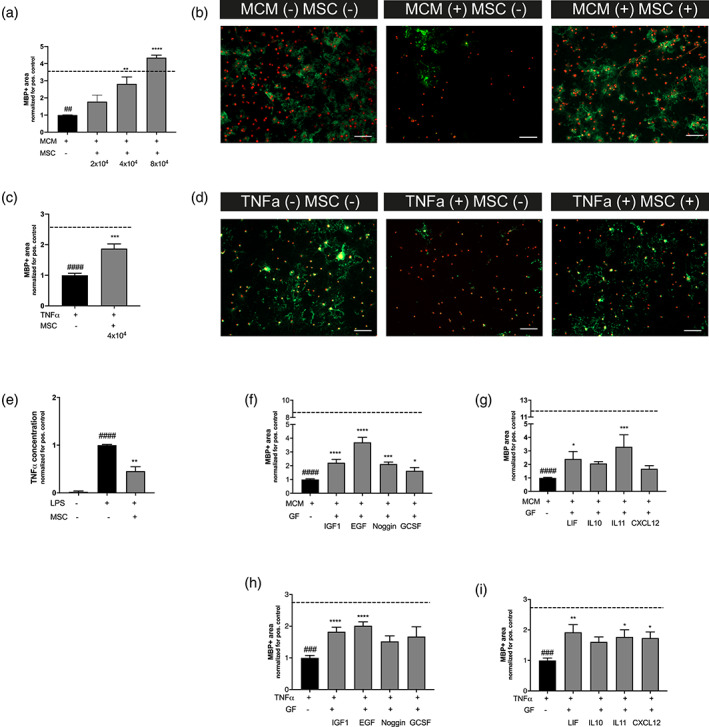
FIGURE 10.

The MSCs secretome boosts OL maturation and attenuates microglia activation in vitro. (a) MCM + LPS causes a reduction in MBP+ area (dashed line represents MBP+ area in MCM‐LPS control condition), MSC treatment with 4 × 10⁴ or 8 × 10⁴ MSCs in a noncontact co‐culture significantly improves OL maturation (n = 3 independent experiments, 3–4 observations per experiment normalized for the positive control, for example, cells exposed to MCM + LPS). (b) Representative fluorescent images (×10) of primary cultured oligodendrocytes stained for oligodendrocyte marker Olig2 (red) and myelin component MBP (green). Cells were exposed to MCM‐LPS (MCM−) or MCM + LPS (MCM+) and 4 × 10⁴ MSCs (MSC+) in a noncontact gel‐insert. Scale bars: 100 μm. (c) Exposure to 10 ng/ml TNFα leads to a reduction in MBP production (dashed line represents MBP+ area in medium without TNFα), MSC treatment with 4x10⁴ MSCs in a noncontact co‐culture significantly boosts OL maturation (n = 2 independent experiments, 3–4 observations per experiment, normalized for the positive control, for example, cells exposed to TNFα). (d) Representative fluorescent images (×10) of primary cultured oligodendrocytes stained for oligodendrocyte marker Olig2 (red) and myelin component MBP (green). Cells were exposed to medium with (+) or without (−) 10 ng/ml TNFα and 4 × 10⁴ MSCs (MSC+) in noncontact gel‐insert. Scale bars: 100 μm. (e). Treatment with 4 × 10⁴ MSCs in a noncontact gel‐insert attenuates microglial TNFα production (n = 2 independent experiments, two observations per experiment, normalized for the positive control, for example, cells exposed to LPS). (f,g) Addition of IGF1, EGF, Noggin, GCSF, LIF, and IL11 but not IL10 and CXCL12 significantly improves MBP+ area by primary cultured oligodendrocytes following MCM + LPS exposure (dashed line represents MBP+ area in MCM‐LPS control condition) (n = 2 independent experiments, 3–4 observations per experiment normalized for the positive control, for example, cells exposed to MCM + LPS). (h,i) Addition of IGF1, EGF, LIF, IL11, and CXCL12 but not Noggin, G‐CSF, and IL10 boosts OL maturation after TNFα‐induced OL maturational arrest (dashed line represents MBP+ area in medium without TNFα) (n = 2 independent experiments, 3–4 observations per experiment, normalized for the positive control, for example, cells exposed to TNFα). ##p < .01; ###p < .001; ####p < .0001 MCM+ or TNF+ condition (black bars) versus MCM‐ or TNFα‐ control (dashed line), respectively; *p < .05; **p < .01; ***p < .001; ****p < .0001 factor‐exposed MCM+ or TNF+ condition (gray bars) versus MCM+ or TNF+ control condition (black bars) [Color figure can be viewed at wileyonlinelibrary.com]
