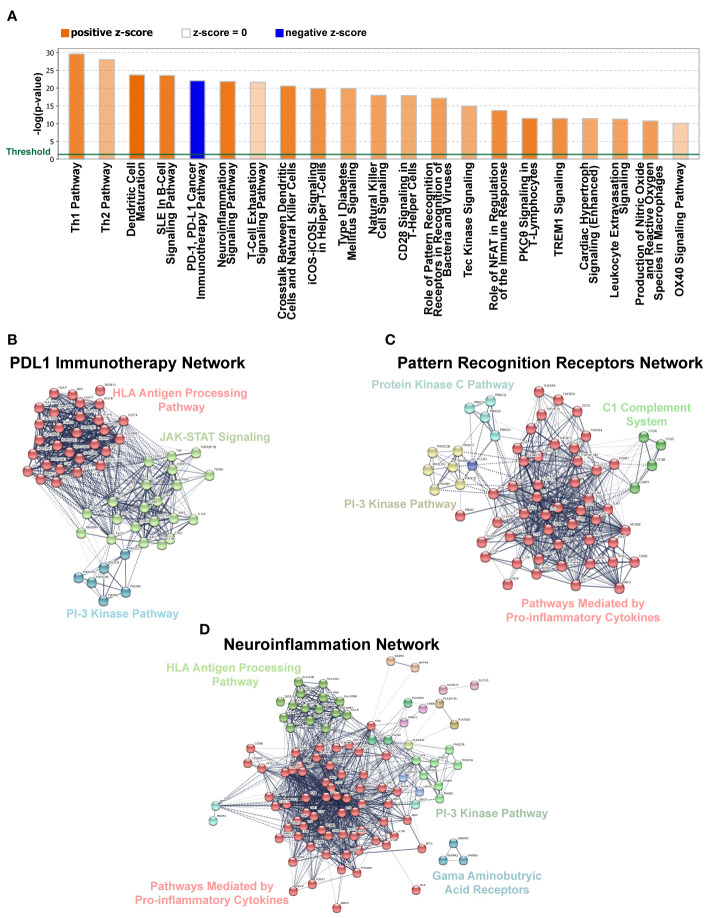
Figure 5.
Gene Networks and Canonical Pathways Generated by Ingenuity Pathway Analysis (IPA). (A) Top 21 significantly affected canonical pathways for DEGs identified in our dataset based on IPA. Bars denote the different pathways based on Z-scores (2.0 < Z score < −2.0). Orange color indicates pathway activation, while blue denotes suppression. (B–D) Gene network analysis using IPA for pathways selected from panel A above. Solid lines denote high correlation between members of a defined cluster and dotted lines denote weak inter-cluster correlation.

