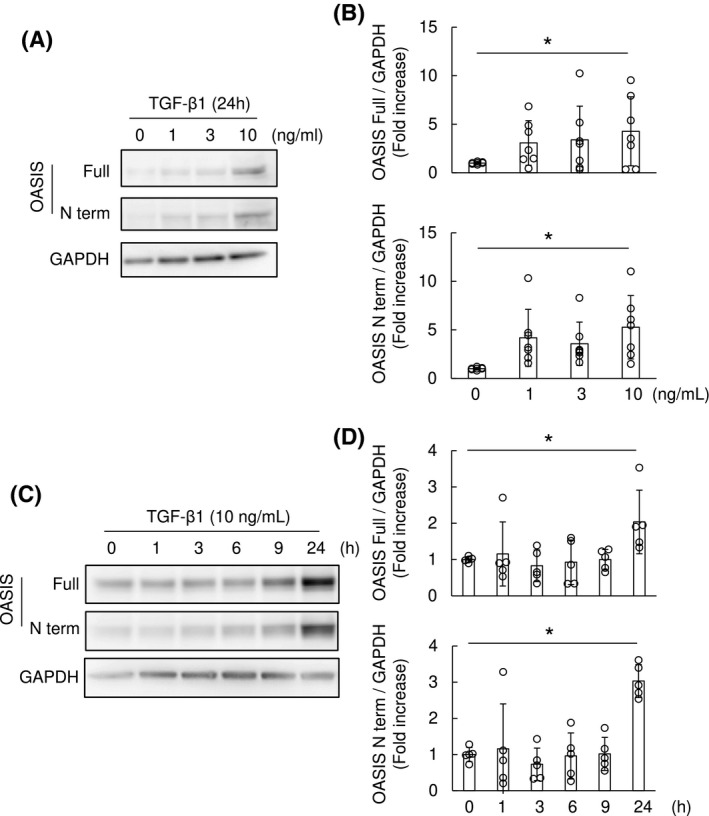
FIGURE 4.

TGF‐β1 increased OASIS expression in NRK49F cells. A and B, NRK49F cells were stimulated with TGF‐β1 at the indicated concentrations for 24 hours. Immunoblotting was performed with anti‐OASIS and anti‐GAPDH antibodies. Representative images and quantitative analysis are shown. Data are shown as mean ± SD * P < .05 vs. Day 0 by ANOVA followed by Williams test, (n = 7). C and D, NRK49F cells were stimulated with TGF‐β1 (10 ng/mL) for the indicated time. The cell lysates were immunoblotted with anti‐OASIS and anti‐GAPDH antibodies. Representative images and quantitative results are shown. Data are shown as mean ± SD * P < .05 vs. Day 0 by ANOVA followed by Williams test (n = 5)
