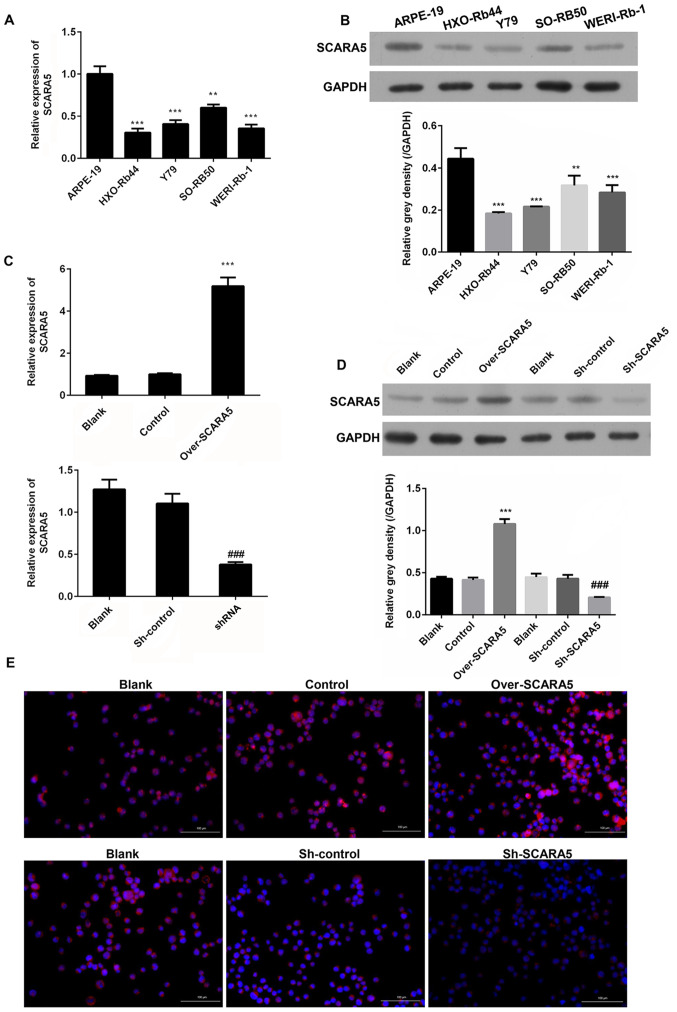
Figure 1.
Comparison of SCARA5 expression levels in four human retinoblastoma cell lines (HXO-Rb44, Y79, SO-RB50, WERI-Rb-1) and a human retinal pigment epithelial cell line (ARPE-19). (A) RT-qPCR analysis of SCARA5 expression. (B) Western blot analysis of SCARA5 expression. **P<0.01, ***P<0.001 vs. ARPE-19. (C) RT-qPCR analysis of SCARA5 expression in Y79 cells with SCARA5 overexpression or knockdown. (D) Western blot analysis of SCARA5 expression in Y79 cells with SCARA5 overexpression or knockdown. Data are presented as the mean ± SEM (n=3 with three repeats). ***P<0.001 vs. Control; ###P<0.001 vs. sh-control. (E) Immunofluorescence analysis of SCARA5 expression in Y79 cells with SCARA5 overexpression or knockdown. Blue signal indicated the nuclei stained by 4,6-diamino-2-phenyl indole (DAPI); Pink signal was produced by the red immunofluorescence (Cy3) signal merging with blue signal stained by DAPI. Scale bar, 100 µm. SCARA5, scavenger receptor class A member 5; RT-qPCR, reverse transcription-quantitative PCR; NC, negative control; shRNA/sh, short hairpin RNA.

