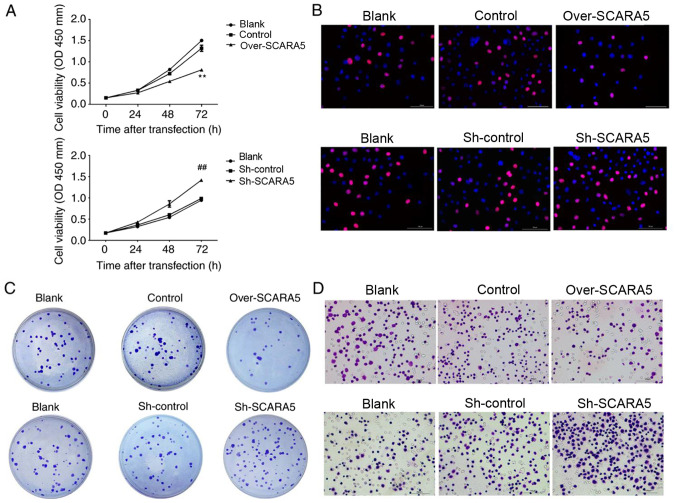
Figure 2.
Effect of SCARA5 overexpression on Y79 cell proliferation and migration. (A) Cell Counting Kit 8 assay curve for the proliferation of Y79 cells with SCARA5 overexpression or knockdown. Data are presented as the mean ± SEM (n=3 with three repeats). **P<0.01 vs. Control; ##P<0.01 vs. Sh-control. (B) Proliferative ability of Y79 cells with SCARA5 overexpression or knockdown, as determined by 5-ethynyl-2′-deoxyuridine assay. Blue signal indicates the nuclei stained with DAPI. Red indicates the EdU signal. (C) Colony formation assay results for Y79 cells with SCARA5 overexpression or knockdown. (D) Transwell assay results for Y79 cells with SCARA5 overexpression or knockdown. Scale bar, 100 µm. SCARA5, scavenger receptor class A member 5; sh, short hairpin RNA.

