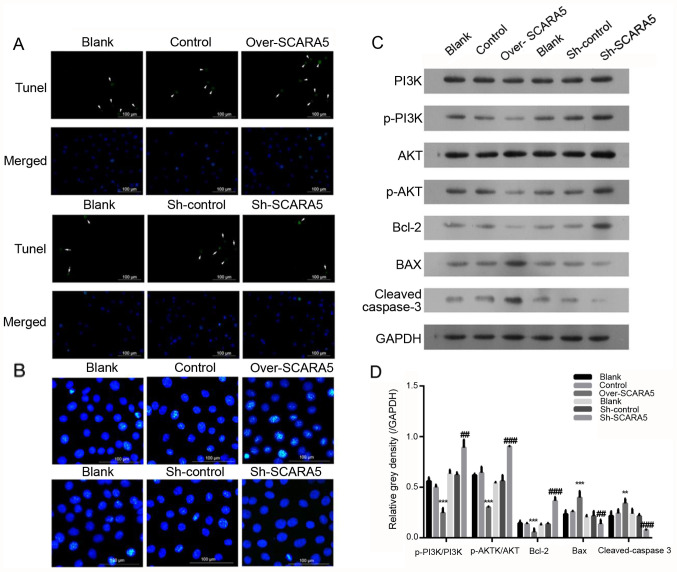
Figure 3.
Effect of SCARA5 overexpression on Y79 cell apoptosis. (A) TUNEL analysis of apoptosis in Y79 cells. The arrows indicate the apoptotic cells with green signal; (B) Hoechst 33342 staining of apoptotic Y79 cells with SCARA5 overexpression or knockdown. The blue signals indicate the apoptotic cells. Scale bar, 100 µm. (C and D) Western blot analysis of PI3K, p-PI3K, AKT, p-AKT, Bax, Bcl-2 and cleaved caspase-3 expression in Y79 cells with SCARA5 overexpression or knockdown. Data are presented as the mean ± SEM (n=3 with three repeats). **P<0.01, ***P<0.001 vs. Control; ##P<0.01, ###P<0.001 vs. Sh-control. SCARA5, scavenger receptor class A member 5; sh, short hairpin RNA; p-, phosphorylated.

