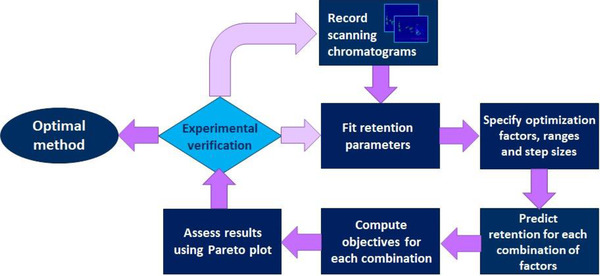
FIGURE 4.

Pareto optimization strategy discussed by Pirok et al. Recorded scanning gradients are used to calculate the retention parameters by fitting the model. By specifying the ranges and step sizes in which the method can be optimized, the program predicts the retention for each component in each combination. The results are assessed in the Pareto plot and the best separation combination is verified through experimental verification. Depending on the verification, more scanning gradients are performed, or the optimal method is chosen. Adapted from [20] with permission
