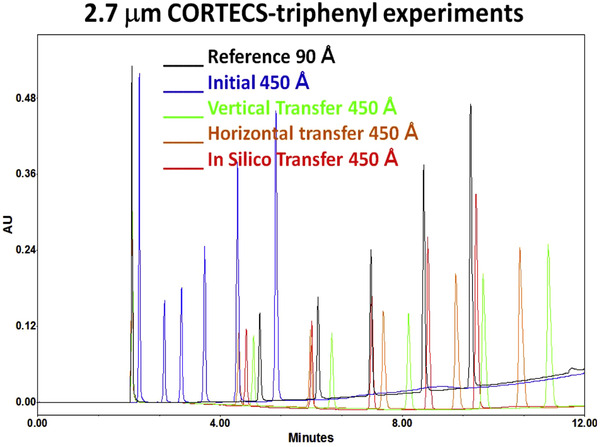
FIGURE 6.

Gradient method transfer between two columns (2.7 μm CORTECS‐triphenyl) with different pore size (90–450 Å). In the figure, the reference gradient chromatogram is shown in black. The direct transfer to a column with a higher pore size is shown in blue. The three different transfer methods are indicated with green (vertical transfer), brown (horizontal transfer) and red (in silico transfer). It is visible that the black line is most similar to the red line, revealing the best gradient method transfer. Reproduced from [80] with permission
