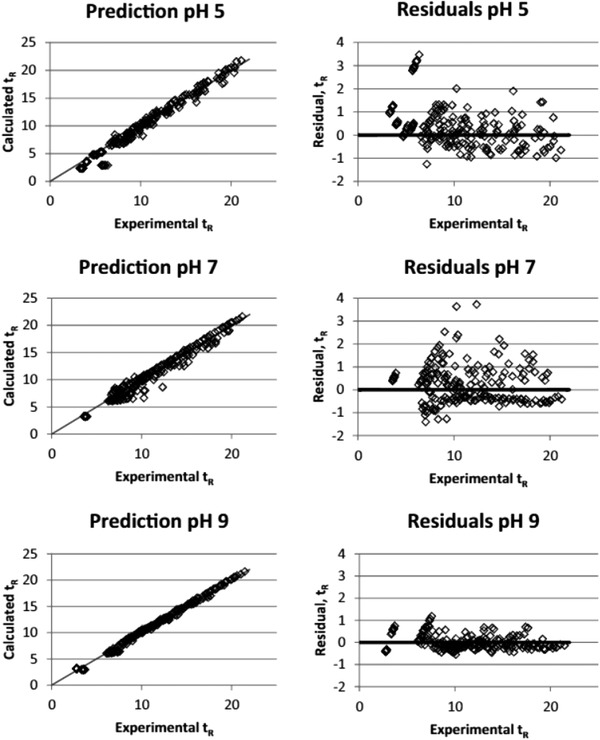
FIGURE 8.

Prediction retention times, calculated with the model in Equation 31, compared to experimental retention times for pH 5, 7, and 9. On the left the two retention times are plotted for each compound and on the right the residuals of the left plot are shown. Retention time is in minutes. Reproduced from [152] with permission
