FIGURE 1.

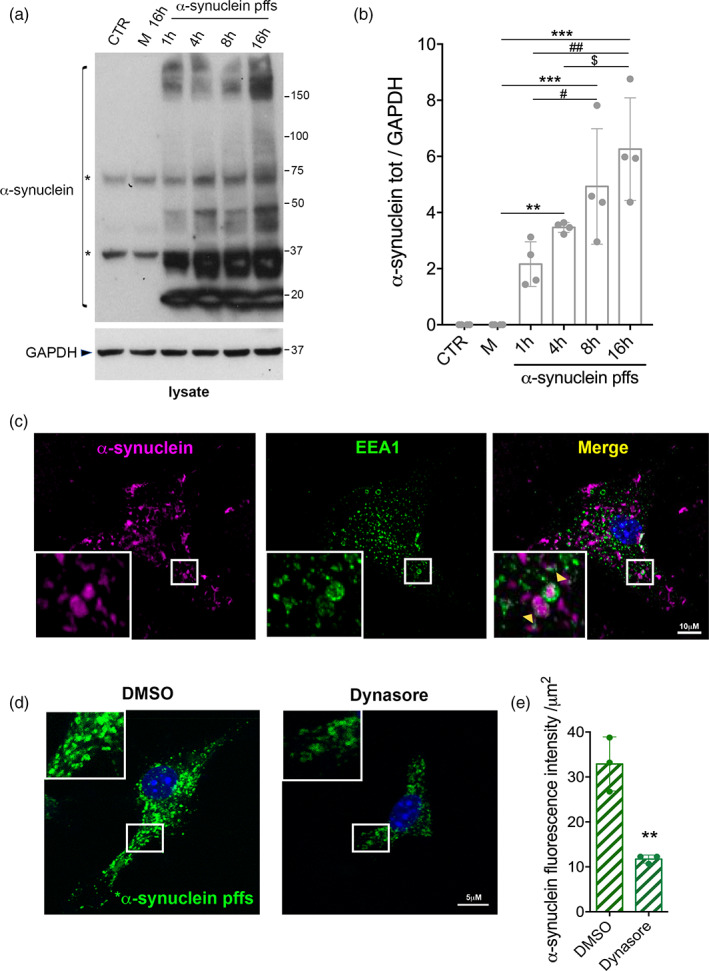
Primary astrocytes take up α‐synuclein preformed fibrils (pffs) through dynamin‐dependent endocytosis. (a) Cell lysates of primary astrocytes treated with α‐synuclein pffs for different times (1, 4, 8, and 16 hr) were subjected to immunoblotting using α‐synuclein and GAPDH antibodies. Monomeric α‐synuclein (M) for 16 hr and untreated cells were used as control. Asterisks in the α‐synuclein immunoblot indicate α‐synuclein nonspecific bands. (b) Quantification of α‐synuclein is normalized to GAPDH protein. Data are representative of four independent experiments and are expressed as the mean ± SD. Data were analyzed using one‐way analysis of variance (ANOVA) followed by Tukey's post hoc test. **p = .0061, α‐synuclein pffs 4 hr versus α‐synuclein M; ***p = .0002, α‐synuclein pffs 8 hr versus α‐synuclein M; ***p < .0001, α‐synuclein pffs 16 hr versus α‐synuclein M; # p = .036, α‐synuclein pffs 8 hr versus α‐synuclein pffs 1 hr; ## p = .0012, α‐synuclein pffs 16 hr versus α‐synuclein pffs 1 hr; $ p = .0341, α‐synuclein pffs 16 hr versus α‐synuclein pffs 4 hr. (c) Maximum intensity Z‐projection confocal images of primary astrocytes treated with α‐synuclein pffs for 16 hr and stained for α‐synuclein (purple), Early Endosome Antigen 1 (EEA1) (green) and nuclei with DAPI (blue). Scale bar 10 μm. (d) Maximum intensity Z‐projection confocal images of primary astrocytes treated with *α‐synuclein pffs and Dynasore, or DMSO as control, for 4 hr. Scale bar 5 μm. (e) Quantification of *α‐synuclein pffs is shown as mean of fluorescence intensity from three independent experiments (~50 cells per experiment). Quantification of *α‐synuclein pffs is calculated as fluorescence intensity divided by the cell area (μm2). Data are expressed as the mean ± SD and analyzed by unpaired t test; **p = .0038. Individual points of the graphs represent each single experiment [Color figure can be viewed at wileyonlinelibrary.com]
