Figure 5.

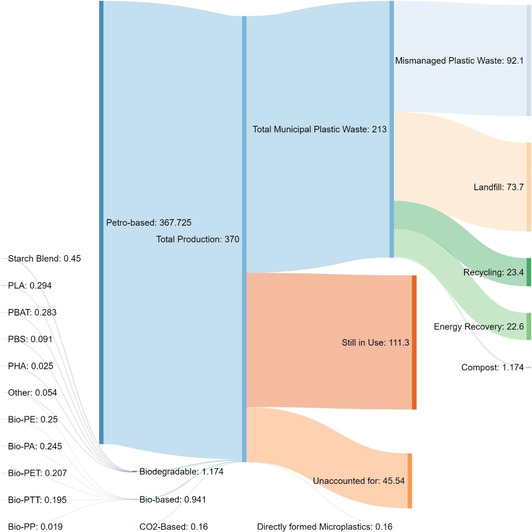
Sankey diagram showing the MFA for fossil‐carbon‐based, bio‐degradable, bio‐based, and CO2‐based plastics in 2019. All values are in millions of tonnes.

Sankey diagram showing the MFA for fossil‐carbon‐based, bio‐degradable, bio‐based, and CO2‐based plastics in 2019. All values are in millions of tonnes.