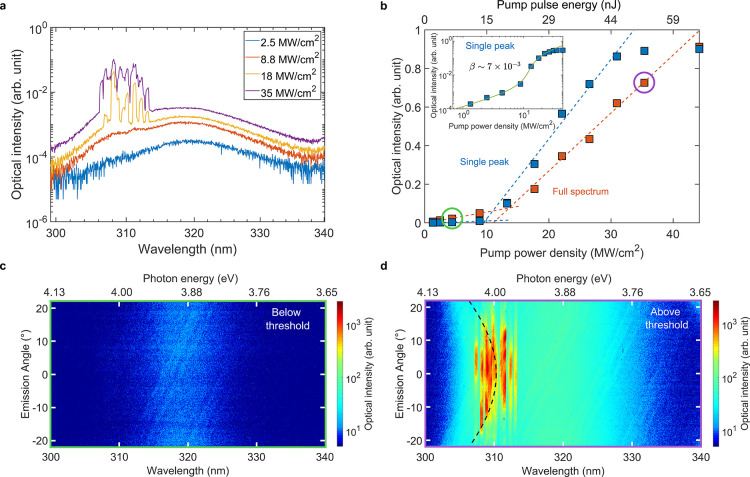
Figure 2.
UVB VCSEL output intensity and spectral characteristics. (a) Logarithmic-scale photoluminescence (PL) emission spectra at room temperature for different pump power densities under pulsed optical pumping. (b) Optical emission intensity at room temperature, integrated over the entire spectrum and around a single lasing peak, as a function of pump power density and energy per pulse. The inset shows the single peak emission plotted versus pump energy in log–log-scale, where the green line is a fit to the measured data. (c) Logarithmic-scale, angle-resolved spectra of the emission below threshold and (d) above threshold. The green and purple circles in (b) mark the data points corresponding to (c) and (d), and the black dashed line in (d) marks the simulated longitudinal cavity mode. The spectral resolution of the measurements is 0.5 nm.

