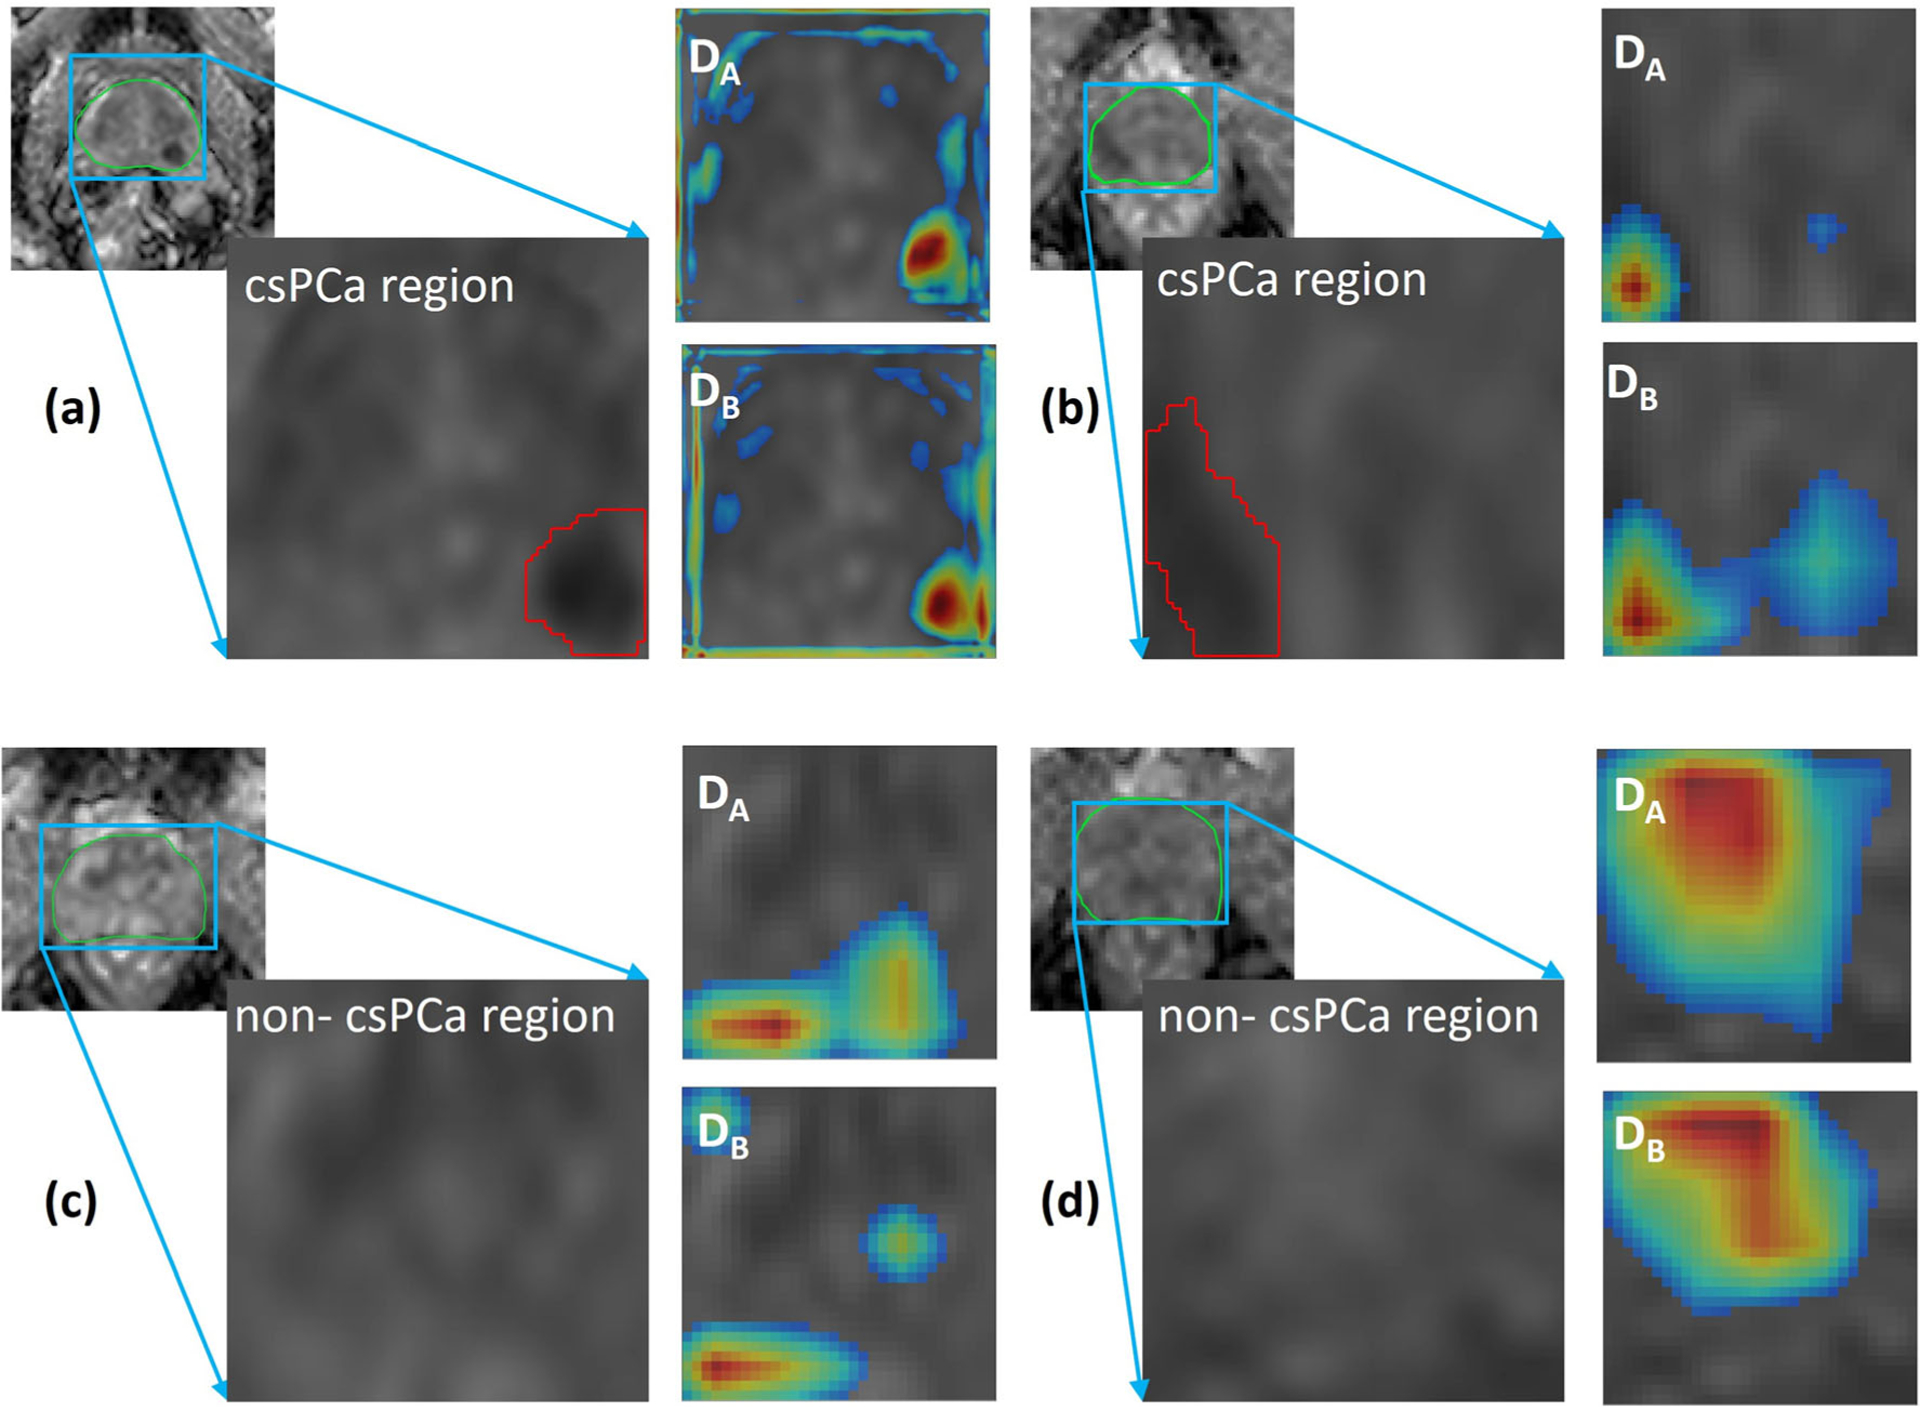
Fig. 6.

Activation maps of CA and CB on (a, b) clinically significant prostate cancer (csPCa: Gleason grade group (GGG) > 1) regions of ADCm (B4b900: b values (0, 300, 500, 900 s/mm2) maps and (c, d) non-csPCa (GGG = 1/benign) regions. The activation map shows that networks look at a darker ADCm region for csPCa regions compared with non-csPCa regions where the network looks at a brighter area. Additionally, when activations are compared between CA and CB, we may observe that the models focus on similar regions
