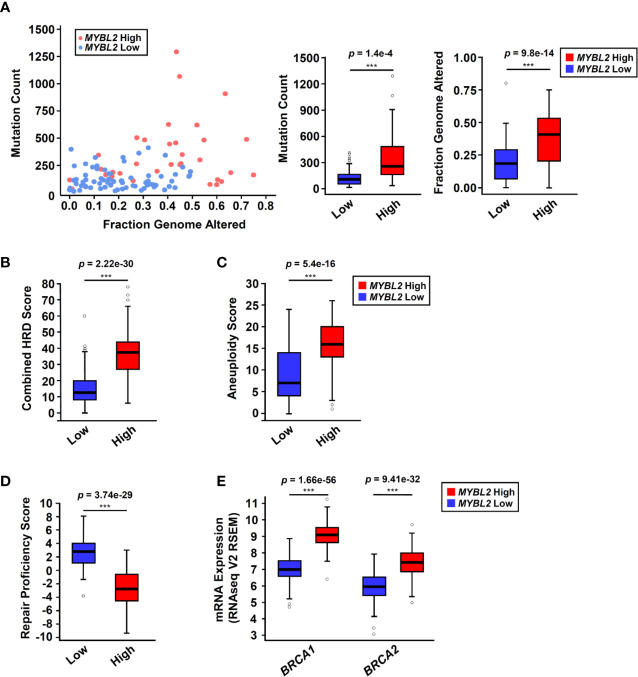
Figure 3.
MYBL2 High tumors exhibit significant genome instability and inefficient homologous recombination. (A) MYBL2 High tumors (N = 33) had significantly greater mutation burden compared to MYBL2 Low tumors (N = 72) (p = 1.4e-4, T-test, two-sided). MYBL2 High tumors (N = 109) also had significantly greater fractions of their genomes altered, compared to MYBL2 Low (N = 139) (p = 9.8e–14, T-test, two-sided). (B) MYBL2 High lung adenocarcinomas (N = 104) display elevated combined homologous recombination deficiency (combined HRD) scores, compared to MYBL2 Low (N = 134) (p = 2.22e–30, T-test, two-sided). (C) MYBL2 High (N = 104) tumors exhibit increased aneuploidy scores, compared to MYBL2 Low (N = 134) (p = 5.4e–16, T-test, two-sided). Combined HRD-scores and aneuploidy scores were calculated and reported by the TCGA PanCancer Atlas consortium (20). (D) MYBL2 High (N = 77) lung adenocarcinomas have significantly lower repair proficiency score (RPS) values when compared to MYBL2 Low (N = 136) (p = 3.74e–29, T-test, two-sided). (E) MYBL2 High lung adenocarcinoma overexpressed BRCA1 (p = 1.66e–56, T-test, two-sided) and BRCA2 (p = 9.41e–32, T-test, two-sided), compared to MYBL2 Low lung adenocarcinoma. (A–E) Boxplot data is displayed as a five-number summary corresponding to data minimum, first quartile, median, third quartile, and maximum.

