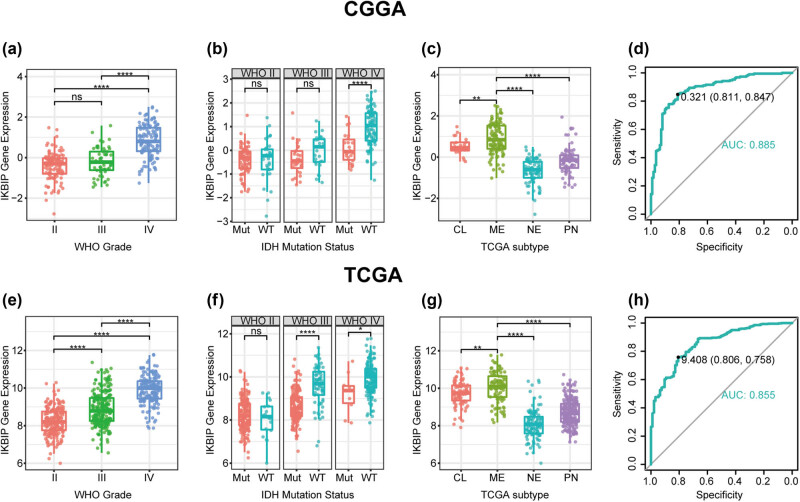
Figure 1.
IKBIP expression in CGGA and TCGA data set according to the WHO grade (a and e), IDH mutation status (b and f), TCGA molecular subtype (c and g) and ROC curves (d and h) for distinguishing mesenchymal subtype. Mut, mutation; WT, wild type; CL, classical; ME, mesenchymal; NE, neural; PN, proneural. * indicates p value < 0.05, **indicates p value < 0.01, *** indicates p value < 0.001, **** indicates p value < 0.0001.

