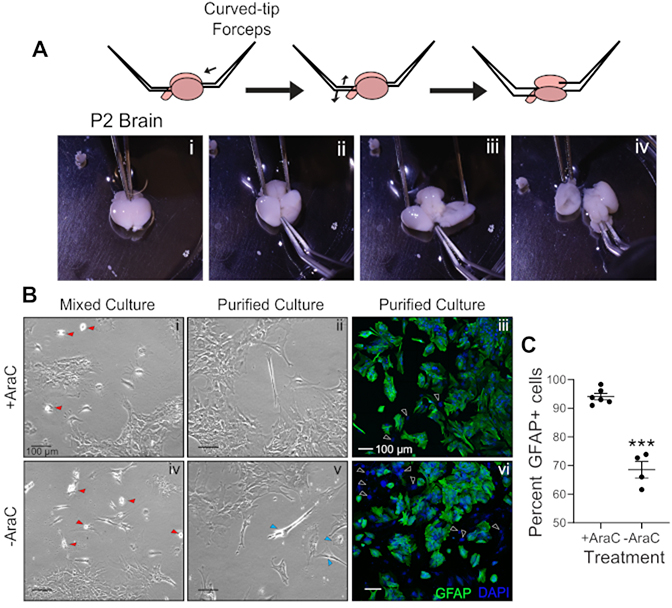
Figure 1: Establishment of primary mouse astrocyte cultures.
(A) Steps required for dissection of P2–P4 mouse brains. (B) (i,iv) Brightfield images of mixed glial cultures treated (i) and non-treated (iv) with AraC. Red arrowheads indicate contaminant microglia. (ii,v) Images of purified astrocyte cultures treated (ii) and non-treated (v) with AraC. Blue arrowheads indicate contaminant oligodendrocytes. (iii,vi) Confocal images of purified astrocyte cultures treated (iii) and non-treated (vi) with AraC. Green shows GFAP staining and DAPI (blue) labels all nuclei. (C) Percentage of GFAP-positive cells. Data represents mean ± SEM. ***p < 0.001, unpaired t-test. Please click here to view a larger version of this figure.

