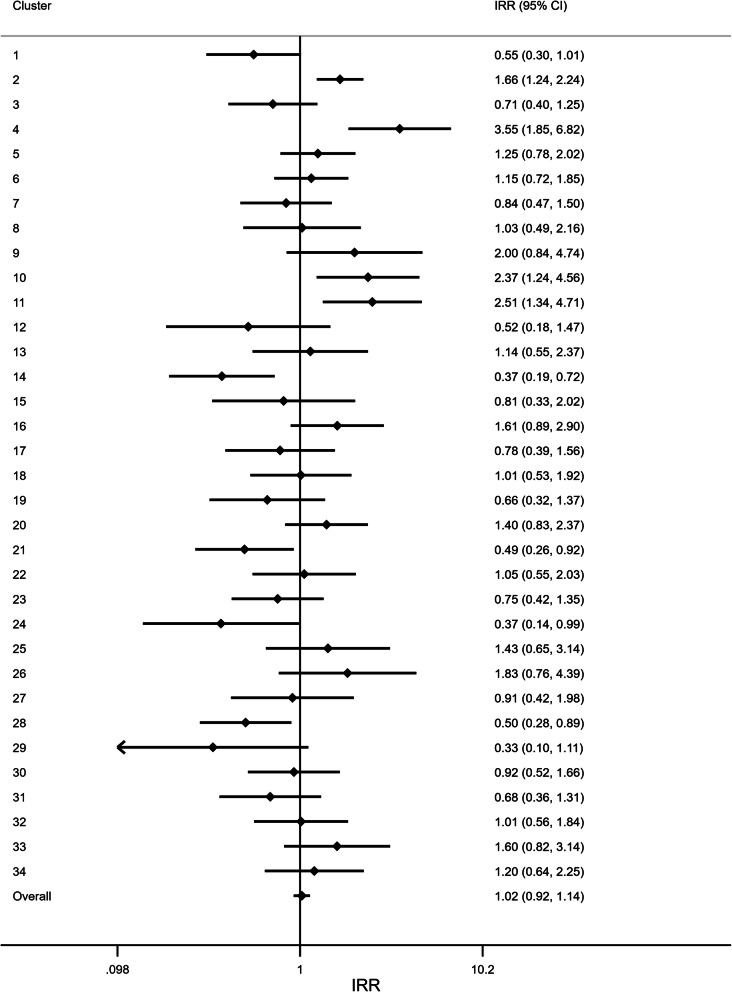
Fig. 4.
Forest plot of the immediate intervention effect in each ward. To explore differential intervention effects across wards, a Poisson regression model was fitted to each ward individually. The estimate here indicates the change in the rate of falls in the month immediately following the intervention implementation to the month preceding it. The overall estimate was obtained by fitting a mixed-effect Poisson regression model to the entire dataset. This model included a fixed effect for: intervention, time, and a time by intervention interaction; and random effects for: ward, time, and post-intervention time. IRR: Incidence rate ratio. CI: Confidence interval

