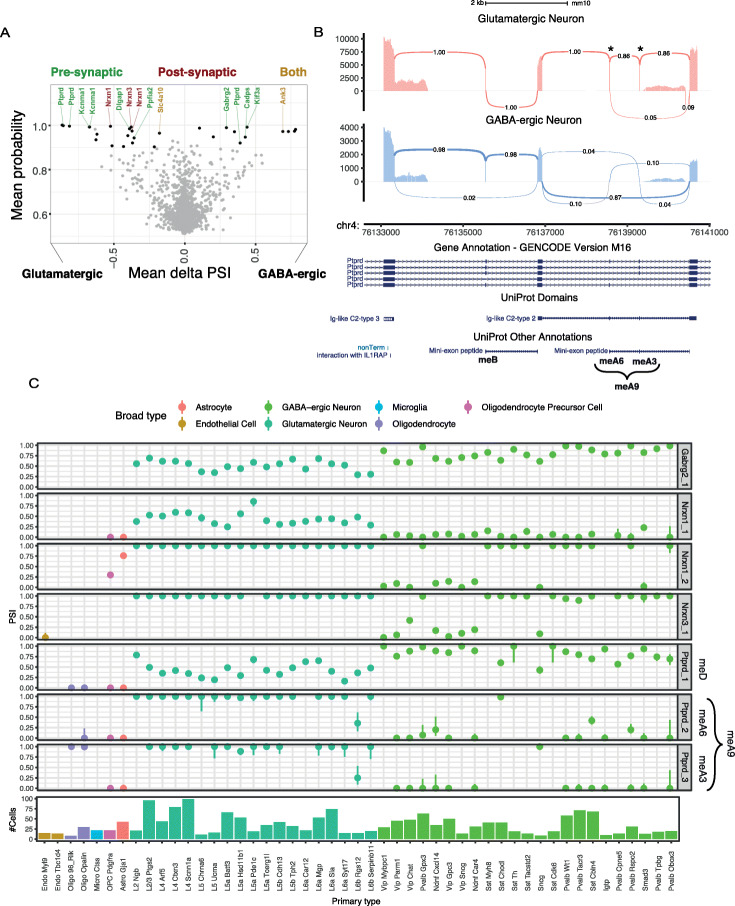
Fig. 7.
Differential alternative splicing analysis of microexons between glutamatergic and GABA-ergic neurons using scRNA-seq data. a Volcano plot showing alternatively included microexons between glutamatergic and GABA-ergic neurons. Differentially included microexons are highlighted in black. Synaptic proteins are labelled with different colours depending on their sub-synaptic localization. b Sashimi plot showing Ptprd microexons that determine the inclusion of meA/B mini-exon peptides. c Microexon inclusion patterns across all core clusters at proteins involved in trans-synaptic interactions. Ptprd microexons involved in the inclusion of mini-exon peptides are labelled on the side (meA and meD)

