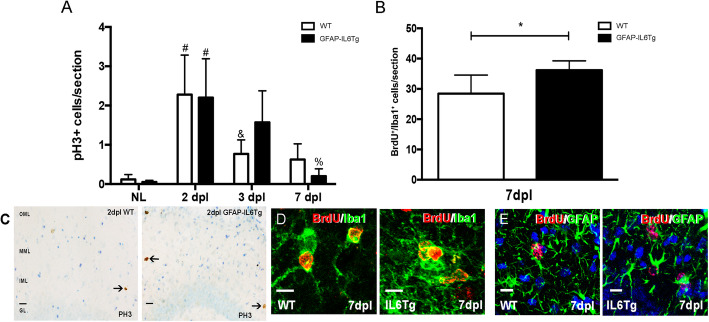
Fig. 2.
Microglial proliferation. a Graph showing the quantification of pH3+ cells in non-lesioned (NL) and PPT-lesioned animals from 2 to 7 dpl, in WT and GFAP-IL6Tg mice. b Graph showing the quantification of BrdU+/Iba1+ cells in PPT-lesioned animals at 7dpl in WT and GFAP-IL6Tg animals. Note that the total number of BrdU+ proliferating cells is significantly higher in transgenic animals. c Representative images of pH3+ cells in WT and Tg animals at 2 dpl. Scale bar = 20um. d Representative images of double IHC combining BrdU (red) and Iba1 (green). e Representative images of double IHC combining BrdU (red) and GFAP (green). Scale bar = 10 μm. For pH3, a minimum of three WT and three GFAP-IL6Tg animals per group were analyzed, whereas in the case of BrdU five WT and six GFAP-IL6Tg animals were used. Data are represented as mean ± SD. The significances are represented as #p ≤ 0.01 vs. NL of respective group; &p ≤ 0.05 vs. 2dpl of respective group and %p ≤ 0.01 vs. 3dpl of respective group. Significant differences between genotypes are represented as *p ≤ 0.05

