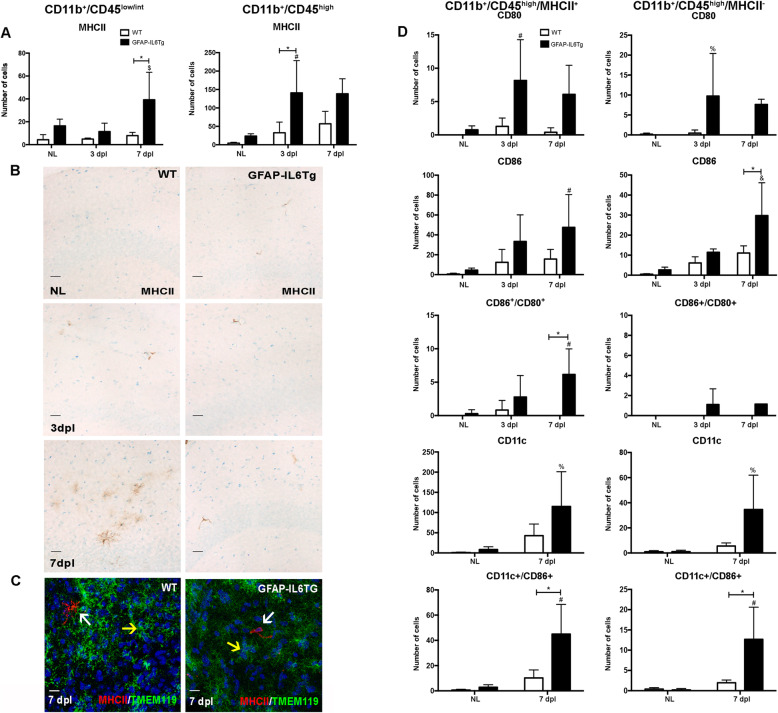
Fig. 3.
Phenotypic analysis of microglia and macrophage populations. a Graphs showing the number of MHCII+ cells in the CD11b+/CD45low/int and CD11b+/CD45high cell population. b Representative images from WT and GFAP-IL6Tg mice showing MHCII staining in the ML of the DG in NL and PPT-lesioned hippocampus from 3 to 7 dpl. Scale bar = 20 μm. c Representative images, from WT and GFAP-IL6Tg mice, of double IHC combining MHCII (red) and Tmem119 (green) at 7 dpl. White arrows indicate MHCII+/Tmem119− cells and yellow arrow indicate microglia Tmem119+ Scale bar = 5 μm. d Graphs showing the number of CD80+, CD86+, and CD11c+ cells in the CD11b+/CD45high/MHCII+ and CD11b+/CD45high/MHCII− cell populations. A minimum of three WT and three GFAP-IL6Tg animals per group were used for this study. Data are represented as mean ± SD. The significances are represented as #p ≤ 0.05 vs NL of respective group; %p ≤ 0.1 vs. NL of respective group; &p ≤ 0.001 vs. NL of respective group and $p ≤ 0.05 vs. 3dpl of respective group. Significant differences between genotypes are represented as *p ≤ 0.05

