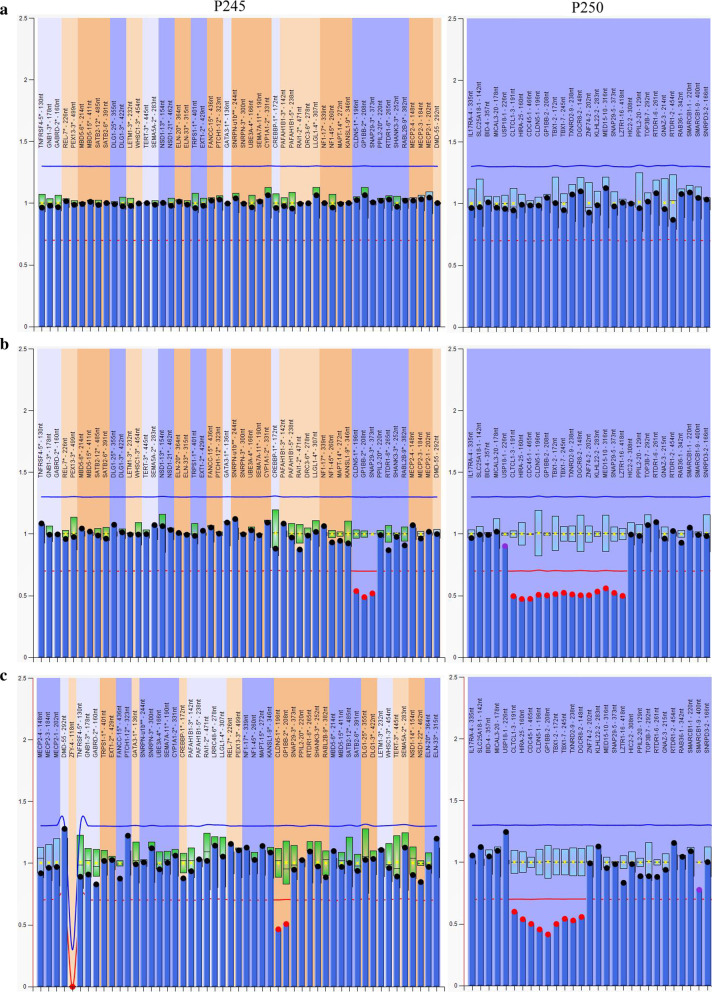
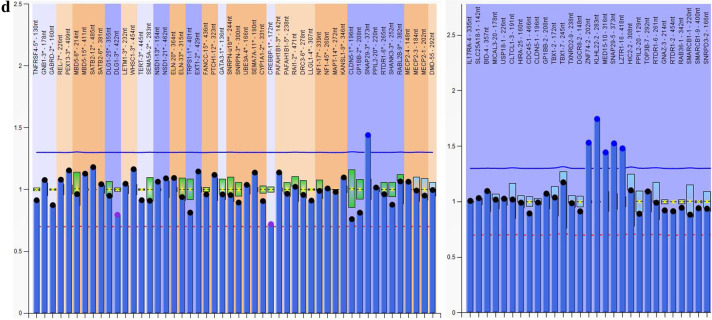
Fig. 2.
Graphs represent results analyzed by Multiplex ligation-dependent probe amplification (MLPA) in three cases and one normal control. X-axis represents MLPA probes (genes) and y-axis represents probe dosage quotient. The blue line indicates probe dosage quotient of 1.35 and any probes above this line represent duplication. The red line indicates probe dosage quotient of 0.65 and any probes below this line represent deletion. The probes between 0.85 and 1.15 are considered as normal controls. a A control with normal copy probes. b A patient carries typical deletion from CLTCL1 to LZTR1 (LCR22 A-D). LCR, low copy repeats. c A patient carries deletion from CLTCL1 to DGCR8 (LCR22 A-B). d A patient carries atypical smaller duplication from ZNF74 to LZTR1 (LCR22 B-D)


