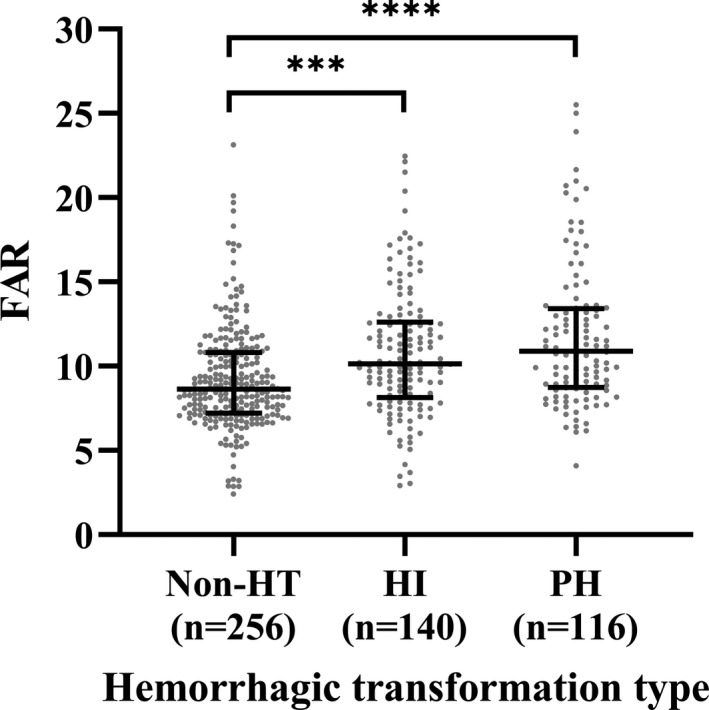
Figure 3.

The levels of FAR in the subcategorized groups of HT. (a) The FAR was higher in patients with HI than those with non‐HT [10.13 (8.14–12.60) vs. 8.64 (7.21–10.80), p < .001]; (b) The FAR was higher in patients with PH than those with non‐HT [10.88 (8.72–13.40) vs. 8.64 (7.21–10.80), p < .001]. The p‐value has been adjusted using Bonferroni correction. FAR, fibrinogen‐to‐albumin ratio; HI, hemorrhagic infarct; HT, hemorrhagic transformation; PH, parenchymal hematoma; ***p < .001
