Figure 4.

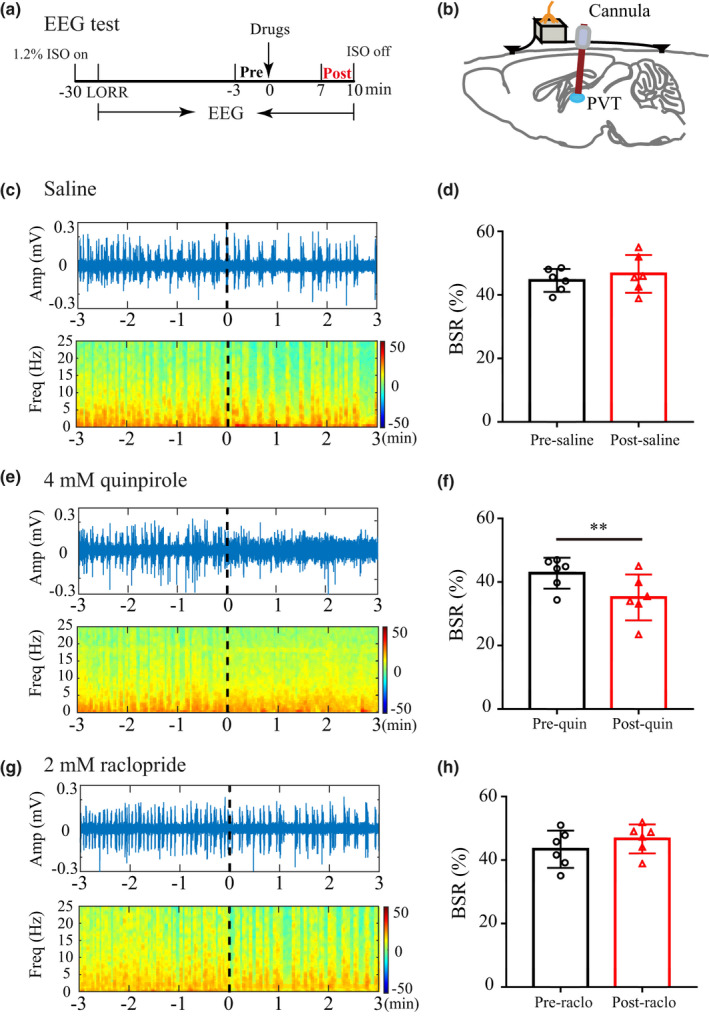
Quinpirole in the PVT reduces the BSR during isoflurane anesthesia. (a) Timeline for EEG recording in isoflurane anesthesia. EEG was recorded throughout the procedure, the 3‐min interval was used to compute BSR before administration (black, “Pre”) and after administration (red, “Post”). (b) Schematic diagram of guide cannula for drug administration and electrode for EEG recording. (c–d) Representative EEG waves and heat map EEG power spectrum before and after microinjection of saline, and saline did not induce significant changes in the BSR. (e–f) Representative EEG waves and heat map EEG power spectrum before and after microinjection of 4 mM quinpirole. Administration of quinpirole into the PVT decreased the BSR from 42.78% ± 4.83% to 35.15% ± 7.24% during 1.2% isoflurane anesthesia maintenance. (g–h) Representative EEG waves and heat map EEG power spectrum before and after microinjection of 2 mM raclopride. Raclopride induced no significant changes in the BSR. Data shown as mean ± SD (n = 6). **p < .01 for figure 4f, p > .05 for figure 4 d,h. Data were analyzed by paired t test
