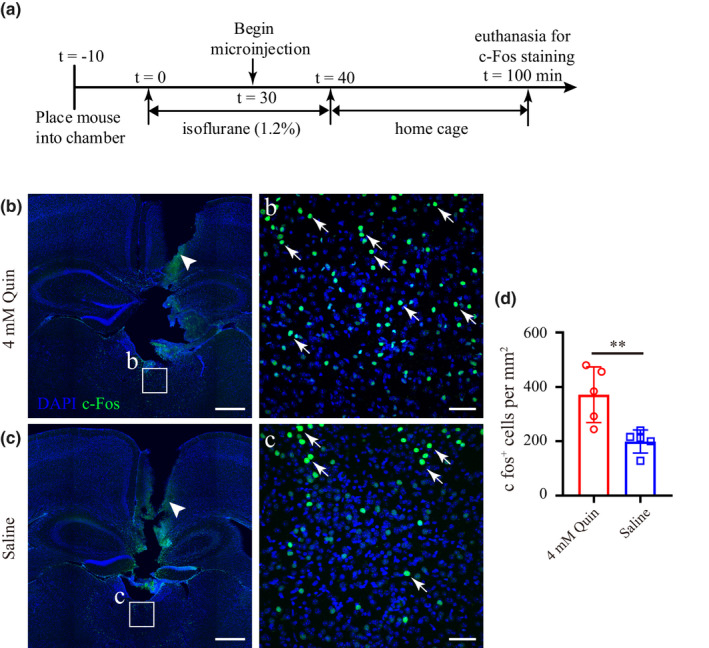
Figure 5.

Quinpirole in the PVT increases the c‐Fos activity. (a) Experimental timeline for c‐Fos staining after quinpirole or saline microinjection. (b, c) Coronal brain sections showing track of guide cannula (white arrow head) above the PVT and c‐Fos expression in mice microinjected with quinpirole (b) or saline (c). Inset (b, c) shown at higher magnification. (d) Statistical analysis of c‐Fos expression in the PVT after quinpirole or saline application. Data shown as mean ± SD (n = 5, five slices per mouse). **p < .01. Data were analyzed by unpaired t test. Scale bar: 500 µm in b and c, 50 µm in b and c
