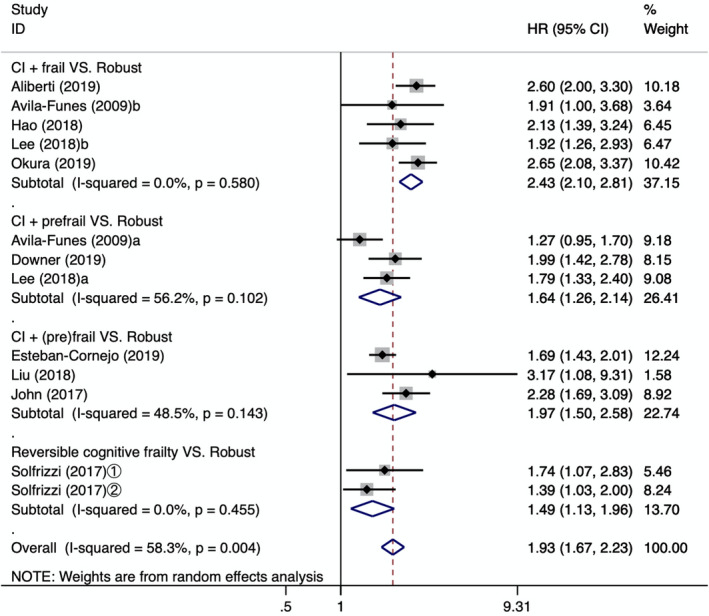
Figure 2.

Forest plot of the association between different types of cognitive frailty and the all‐cause mortality. CI: cognitive impairment; a: cognitive impairment + prefrail; b: cognitive impairment + frail; ①: follow‐up 3.5 years; ②: follow‐up 7 years; HR: hazard ratio; 95%CI: 95% confidence interval
