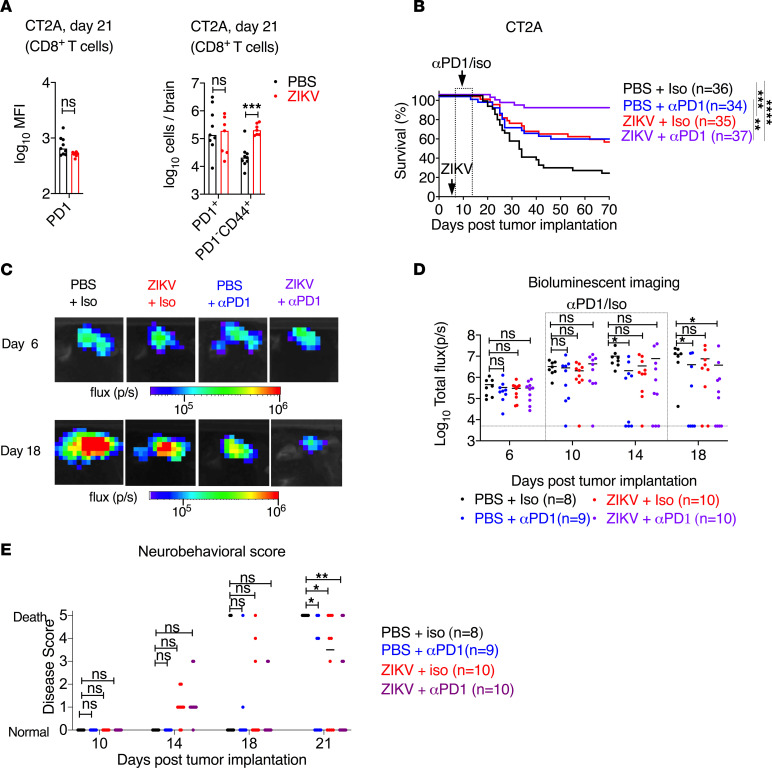
Figure 4. ZIKV and anti–PD-1 protect against glioma in mice.
(A) MFI of PD-1 expression on CD8+ T cells and total numbers of PD1+CD8+ T cells and PD1–CD8+CD44+ T cells from PBS- or ZIKV-treated, glioma-bearing mice at day 21 after tumor implantation (14 days after ZIKV treatment). (B) Survival analysis of mice bearing CT2A tumors, treated with ZIKV or PBS on day 7 and anti–PD-1 or isotype control antibody as described in the Methods (n = 34–37). (C) Representative images from B at day 6 and day 18 after tumor implantation (11 days after ZIKV treatment). (D) Photon flux of bioluminescence images from CT2A tumor–bearing mice treated as in B. (E) Neurobehavioral score (0 to 5) as described in Methods in CT2A tumor–bearing mice treated with antibody against PD-1 or isotype control. Bars/horizontal lines indicate median values. The dotted line denotes the limit of detection (D). Data are from 2 independent experiments. Statistical differences were determined by (A) Mann-Whitney U test (***P < 0.001), (B) log-rank test (**P < 0.01; ***P < 0.001; ****P < 0.0001), and (D and E) 2-way ANOVA test with Dunnett’s posttest (*P < 0.05; **P < 0.01).

