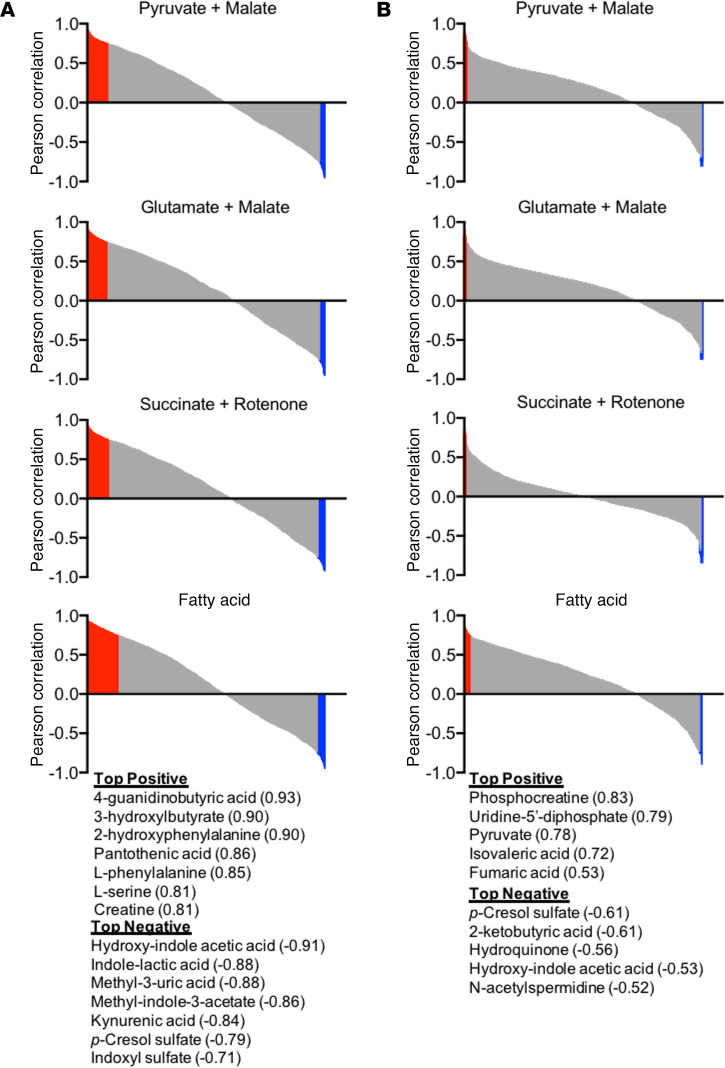
Figure 7. Accumulation of uremic metabolites in muscle associates with the degree of mitochondrial impairment.
(A) Pearson correlations between metabolite concentration (peak area) and OXPHOS conductance for male mice (n = 3 control, n = 5 CKD). (B) Pearson correlations between metabolite concentration (peak area) and OXPHOS conductance for female mice (n = 5 control, n = 5 CKD). Metabolites with Pearson correlations with a P < 0.1 are shown in red (positive) or blue (negative). Top positive and negative correlating metabolites are listed by name and their corresponding Pearson correlation coefficient. Metabolite identities were determined using MetaboAnalyst 4.0.

