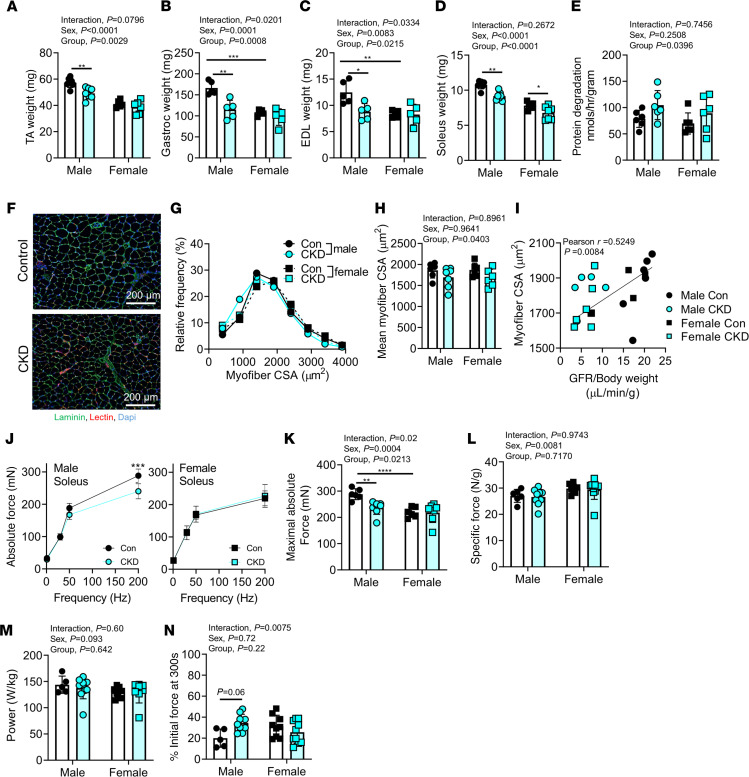
Figure 8. Adenine-induced CKD causes atrophy and increased protein degradation in muscle but does not alter muscle-specific force.
(A–D) Quantified muscle weights for (A) TA, (B) gastrocnemius, (C) EDL, and (D) soleus muscles of control and CKD mice (n = 5–7/group/sex). (E) Protein degradation rates of soleus muscles in control and CKD mice (n = 6/group/sex). (F) Representative immunofluorescence images of the soleus muscle sections stained with laminin (myofibers), GS-lectin (capillaries), and DAPI (nuclei). (G) Histogram of soleus myofibers CSAs indicates a leftward shift in CKD mice (indicative of atrophy) (n = 6–7/group/sex). (H) Mean soleus myofibers CSA (n = 6–7/group/sex). (I) Pearson correlation between mean myofibers CSA and GFR across groups. (J) An abbreviated force frequency curve was used to assess soleus muscle force production ex vivo. Quantified peak absolute force (K) and specific force (L) (n = 5–10/group/sex). (M) Muscle power was quantified using a shortening contraction (n = 5–10/group/sex). (N) Muscle fatigue was assessed and quantified using repeated tetanic contractions (1/s) for 5 minutes (n = 5–10/sex/group). *P < 0.05, **P < 0.01, ***P < 0.001, and ****P < 0.0001 using 2-way ANOVA and Tukey’s post hoc when appropriate. Error bars show standard deviation. Scale bars: 200 μm.

