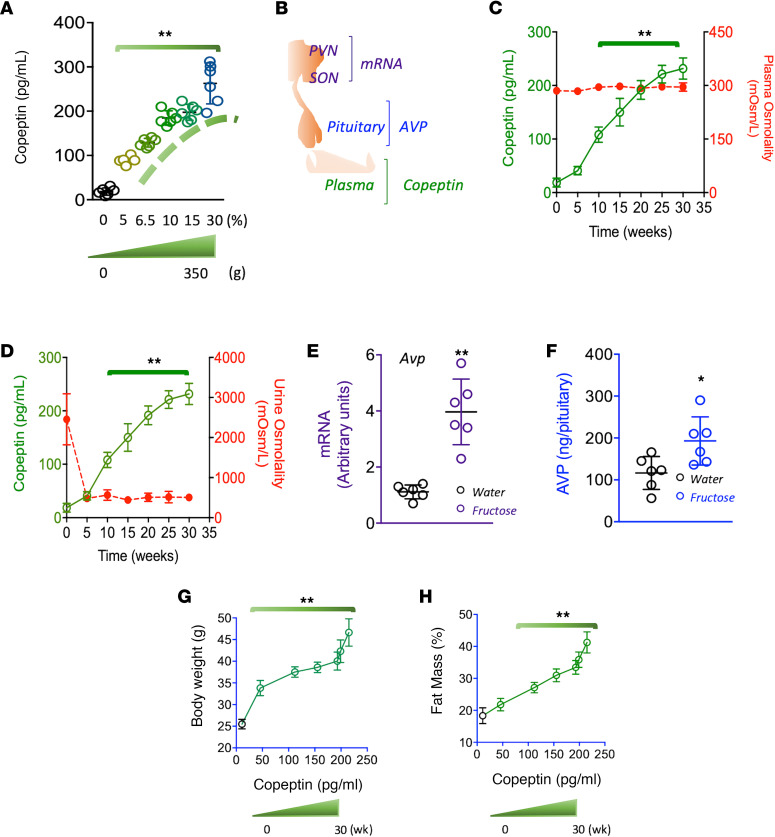
Figure 1. Fructose promotes vasopressin production and secretion during the development of metabolic syndrome.
(A) Serum copeptin levels in mice receiving fructose solutions (from 0 to 30%) for 30 weeks. Cumulative fructose intakes varied from 0 to 350 g/mouse. (B) Schematic depicting the areas for vasopressin production (hypothalamic nuclei), accumulation (posterior pituitary), and secretion (serum). (C) Serum copeptin and osmolality levels in mice receiving a 10% fructose solution for 30 weeks. (D) Serum copeptin levels and urinary osmolality in mice receiving a 10% fructose solution for 30 weeks. (E) Hypothalamic mRNA levels of vasopressin in mice receiving water or a 10% fructose solution for 30 weeks. (F) Vasopressin levels in pituitary of mice receiving a 10% fructose solution for 30 weeks. (G) 5-week body weight/copeptin correlations in mice receiving a 10% fructose solution for 30 weeks. (H) Adiposity (% of fat mass) in mice receiving a 10% fructose solution for 30 weeks. The data in A and C–H are presented as the mean ± SD and analyzed by 1-way ANOVA with Tukey’s post hoc analysis. *P < 0.05, **P < 0.01. n = 6 mice per group. PVN, paraventricular nuclei; SON, supraoptic nuclei.

