
FIGURE 1.
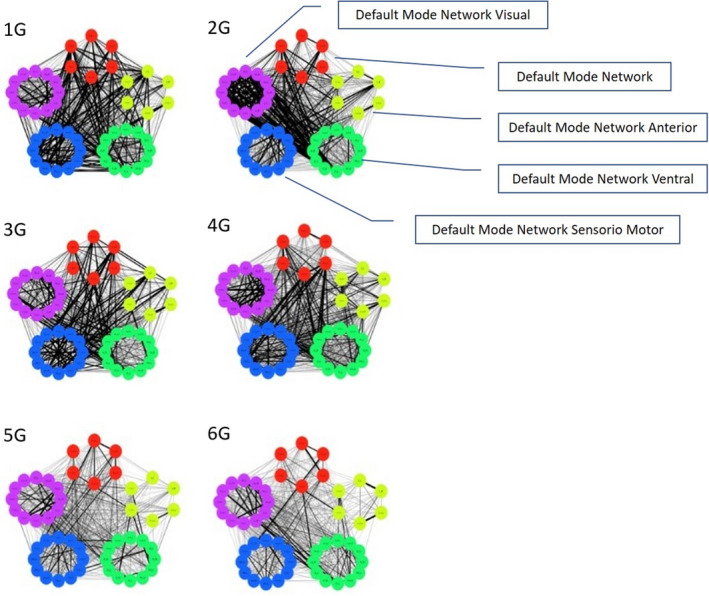
Representative graphs of high connectivity (1g and 2g); medium connectivity (3g and 4g); and low connectivity (5g and 6g). Red: DMN posterior; yellow: DMN anterior; green: DMN ventral; blue: sensorimotor; and purple: visual. The number of each ROI is listed in Table 1