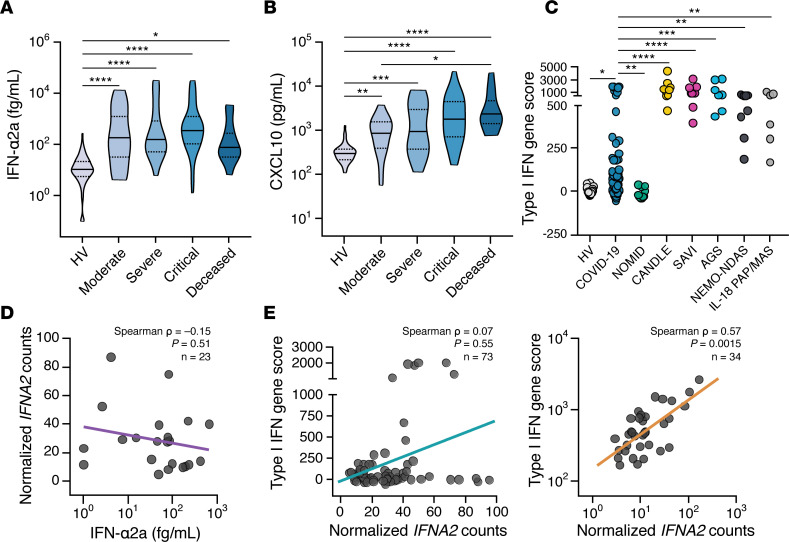
Figure 5. Type I IFN mediators are increased in COVID-19 patients, but the transcriptional response of type I IFN genes in circulating immune cells is disproportionally low.
(A–B) Shown are (A) IFN-α2a and (B) CXCL10 levels in peripheral blood of COVID-19 patients with various severity groups (n = 94–114 depending on the biomarker) relative to healthy volunteers (HV; n = 45–67 depending on the biomarker). Groups were compared by Kruskal-Wallis test. When P < 0.05, pairwise comparisons were made using Dunn’s test with Benjamini-Hochberg adjustment for multiple comparisons. *P < 0.05, **P < 0.01, ***P < 0.001, ****P < 0.0001. (C) Expression of 28 type I IFN–induced genes was measured by NanoString and expressed as log10-transformed summary z scores. Shown is comparison of HVs (n = 22), COVID-19 patients (n = 84), and patients with the NLRP3 inflammasomopathy NOMID (n = 11); and the type I IFNopathies CANDLE (n = 9), SAVI (n = 9), and AGS (n = 7); the CANDLE mimic NEMO-NDAS (n = 9); and the IL-18opathy IL-18 PAP/MAS (n = 6). NOMID, neonatal onset multisystem inflammatory disease; CANDLE, chronic atypical neutrophilic dermatosis with lipodystrophy and elevated temperature; SAVI, STING-associated vasculopathy with onset in infancy; AGS, Aicardi-Goutières syndrome; NEMO-NDAS, NF-κB essential modulator-deleted exon 5 autoinflammatory syndrome; IL18 PAP/MAS, IL-18–mediated pulmonary alveolar proteinosis and macrophage activation syndrome. (D) Correlation of the transcript levels of IFNA2 in whole blood with blood levels of IFN-α2a in patients with COVID-19 (n = 22). (E) Correlation of the 28 type I IFN–induced gene score with transcript levels of IFNA2 in patients with COVID-19 (left panel) (n = 73) compared with the indicated type I IFNopathies (right panel) (n = 34).

