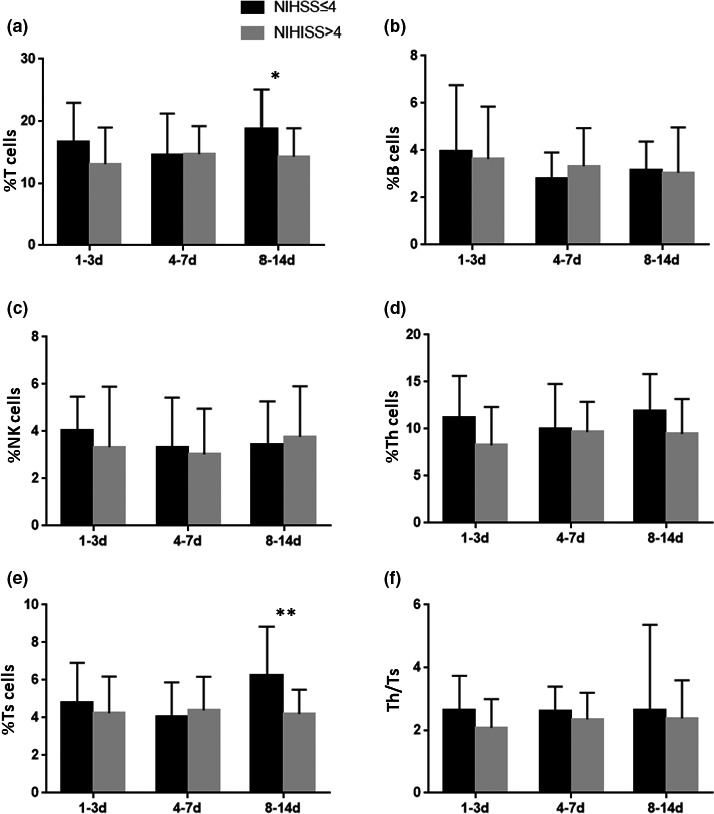
FIGURE 2.

The relationship between temporal change of lymphocyte subsets and the severity in AIS patients. The percentages of T cells and Th cells on 8–14 group in NIHSS ≤4 group were significantly higher than those in NIHSS >4 group. Notes: % T cells = T‐cell count/leukocyte count, % B cells = B‐cell count/leukocyte count, % NK cells = NK‐cell count/leukocyte count, %Th cells = Th‐cell count/leukocyte count, %Ts cells = Ts‐cell count/leukocyte count. *p < .05, **p < .01
