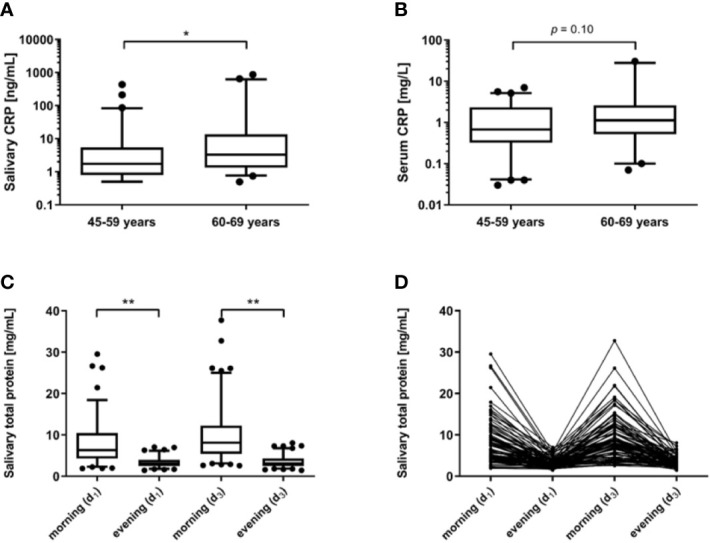
Figure 1.

C-reactive protein (CRP) in (A) saliva samples (n=102, shown are mean values of measurements in morning and evening saliva), and (B) sera (n=96). Participants were grouped into two age classes (45–59 years and 60–69 years, respectively) and compared using Mann-Whitney U test. Box plots reflect the interquartile range (IQR) with the median shown as a line and the 5th–95th percentiles as bars (* p<0.05). Spectrophotometric measurement of salivary total protein levels in morning and evening samples of the first (d1) and third day (d3) of sampling. (C) Differences in morning and evening levels of the same day were identified by Wilcoxon tests. Box plots reflect the IQR with the median shown as a line and the 5th–95th percentiles as bars (** p<0.01). (D) The four related total protein levels shown for each participant.
