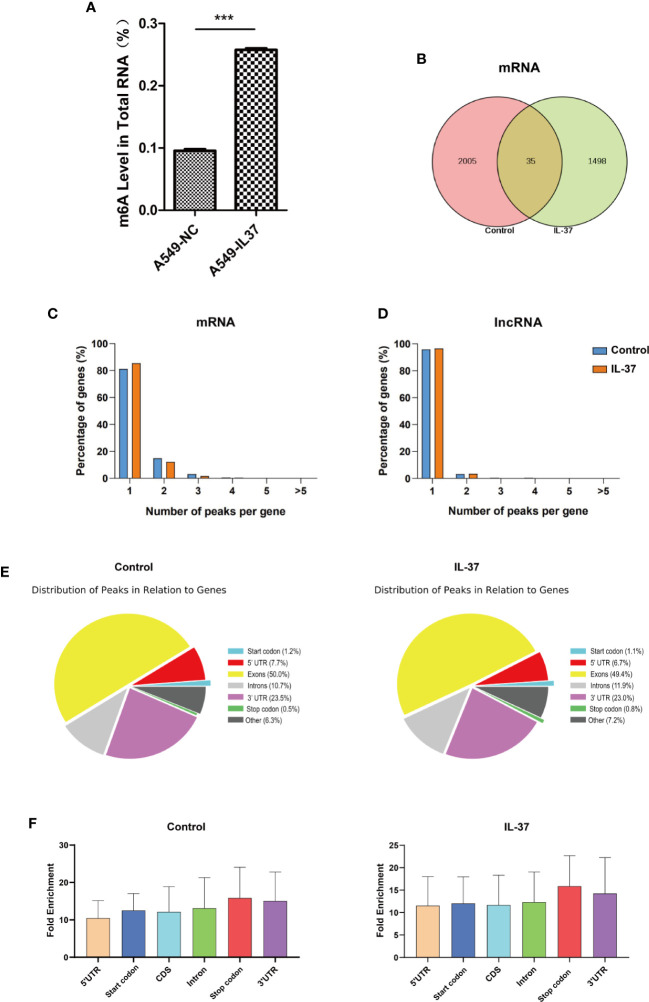
Figure 3.
General features of m6A methylation in IL-37 treated and untreated A549 cells. (A) Higher global m6A modification sites in IL-37 treated cells than in IL-37 untreated cells. Data are mean ± SEM (n = 6 per group) (*** means P < 0.001); (B) Venn diagram showing the overlap of m6A peaks within mRNAs in two groups; (C) Proportion of mRNAs harboring different numbers of m6A peaks in two groups. The majority of genes harboring only one m6A peak; (D) Proportion of lncRNAs harboring different numbers of m6A peaks in two groups. The majority of genes harboring also only one m6A peak; (E) Pie charts showing the percentage of m6A peaks in nonoverlapping segments of transcripts; (F) Distributions of fold enrichment of m6A peaks. Data are mean ± SEM.

