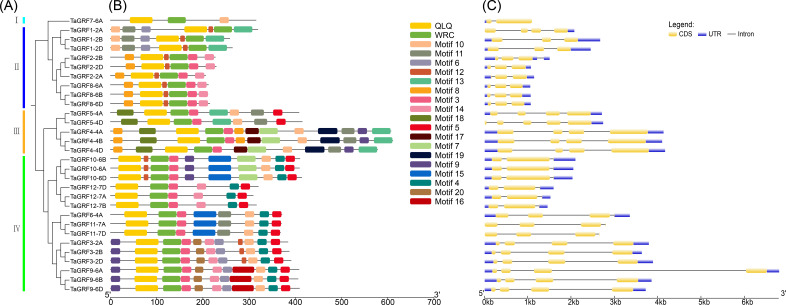
Figure 1. Gene structure and motif analysis of TaGRF.
(A) The phylogenetic tree of TaGRF. This tree consists of 1,000 bootstraps created by the Neighbor-Joining (NJ) method in MEGA7. (B) The motif of TaGRF was identified by MEME. MAST was used to display patterns. Each pattern is represented by a specific color. A red dot indicates a motif associated with a functional domain. (C) Exon-intron structure of TaGRF. Exon-intron structure analysis was performed using GSDS. The length of exons and introns is shown proportionally. Uuntranslated regions (UTR) are represented by blue boxes, exons are indicated by yellow boxes, and introns are indicated by black lines.

