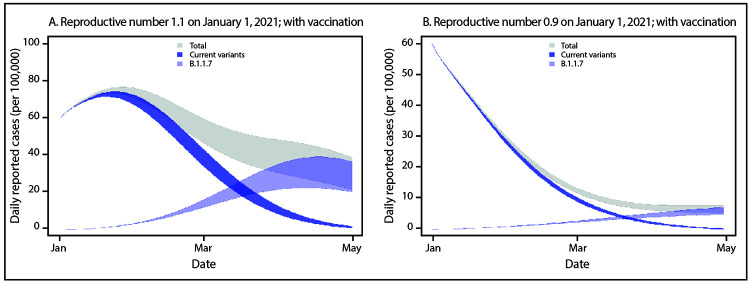
FIGURE 2.
Simulated case incidence trajectories* of current SARS-CoV-2 variants and the B.1.1.7 variant,† assuming community vaccination§ and initial Rt = 1.1 (A) or initial Rt = 0.9 (B) for current variants — United States, January–April 2021
Abbreviation: Rt = time-varying reproductive number.
* For all simulations, it was assumed that the reporting rate was 25% and that persons who were seropositive or infected within the simulation became immune. The simulation was initialized with 60 reported cases of SARS-CoV-2 infection per 100,000 persons (approximately 200,000 cases per day in the U.S. population) on January 1, 2021. Bands represent simulations with 10%–30% population-level immunity as of January 1, 2021.
† Initial B.1.1.7 prevalence is assumed to be 0.5% among all infections and B.1.1.7 is assumed to be 50% more transmissible than current variants.
§ For vaccination, it was assumed that 300 doses were administered per 100,000 persons per day (approximately 1 million doses per day in the U.S. population) beginning January 1, 2021, that 2 doses achieved 95% immunity against infection, and that there was a 14-day delay between vaccination and protection.

