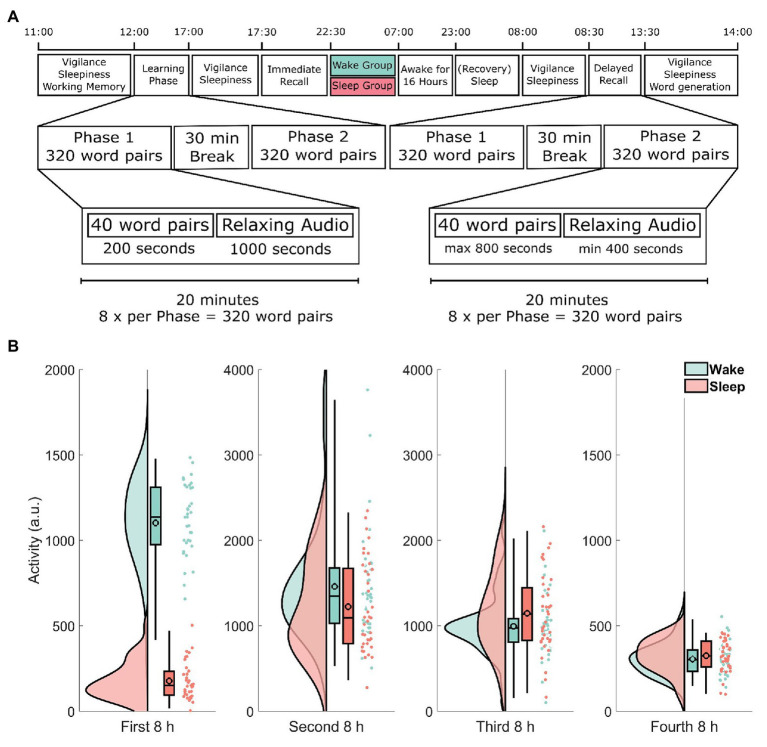
Figure 1.
(A) Timeline of the experimental procedure. Learning started at 12:00 h and was followed by an immediate recall at 17:30 h as well as a delayed recall at 8:00 h 2 days later. The learning and recall phases each took 5 h and consisted of two parts each roughly 2 h 15 min long, separated by a 30-min break. During each part, participants either learned or retrieved 320 word-pairs for a total of 640 word-pairs. Each part was further divided into eight blocks of 40 word-pairs. Each block took exactly 20 min. During the learning phase participants spent 3 min and 20 s per block learning word-pairs one at a time and then listened to 16 min and 40 s of relaxing audio files. During the recall phase participants had up to 20 s (a maximum of 13 min and 20 s per block) to respond to each of the sequentially shown cue words by typing the correct target word. Participants spent the remaining time listening to a relaxing audio file. Note that both recall phases (immediate and delayed recall) followed exactly the same procedure. (B) Actimetry data. Each participant was given an actigraph at the end of immediate recall to verify compliance. The y-axis shows the activity of each participant during each of the four 8-h periods in arbitrary units. Each raincloud plot consists of the estimated distribution, a box-plot (indicating the median and the 2, 25, and 98% quantiles, the black outlined circles depict the mean) and the activity estimations for each subject as an individual point. Data from participants in the wake group are shown in green, whereas data from the sleep group are shown in red. Note the different scale used here. See Allen et al. (2018) for the code used in this visualization.

