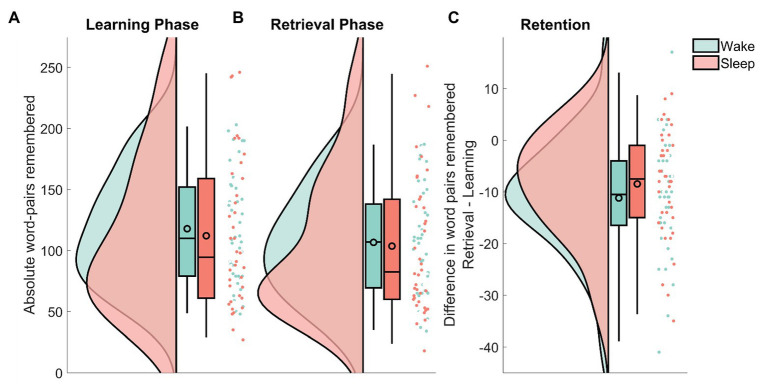
Figure 2.
Raincloud plots (curves depict the estimated distribution, box-plots provide the median and the 2, 25, 75, and 98% quantiles, the black outlined circles depict the mean, the dots show individual data points) of the remembered word-pairs for the wake group (green) and the sleep group (red). (A) The absolute amount recalled during immediate recall that was part of the learning phase. (B) The absolute amount recalled during delayed recall that was part of the retrieval phase. (C) The difference in word-pairs remembered between retrieval and learning. Note the different scale used here. See Allen et al. (2018) for the code used in this visualization.

